. 2016 Feb 9:10:42.
doi: 10.3389/fnhum.2016.00042. eCollection 2016.

Statistical Regularities Attract Attention when Task-Relevant

Affiliations

Statistical Regularities Attract Attention when Task-Relevant

Andrea Alamia et al. Front Hum Neurosci. .

Abstract

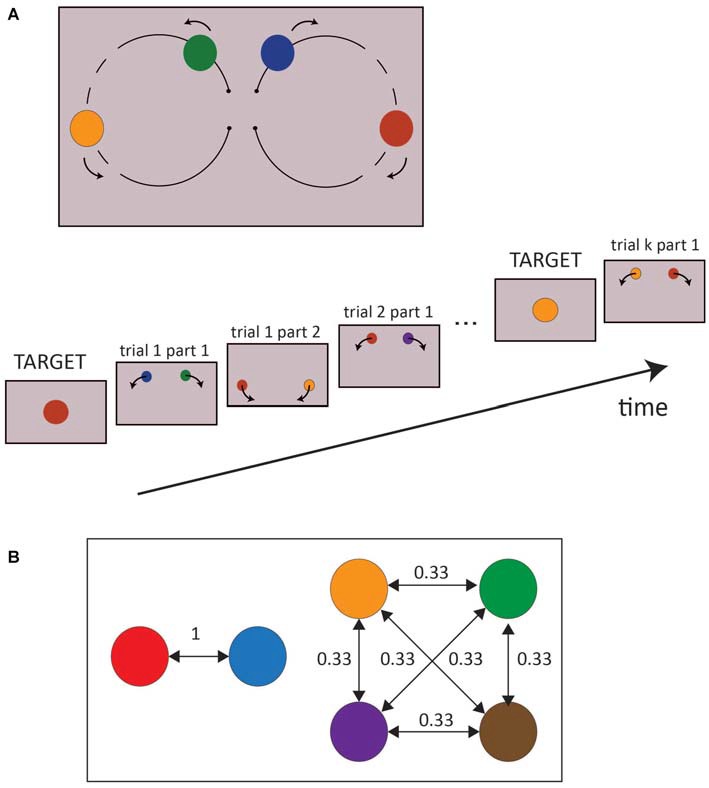
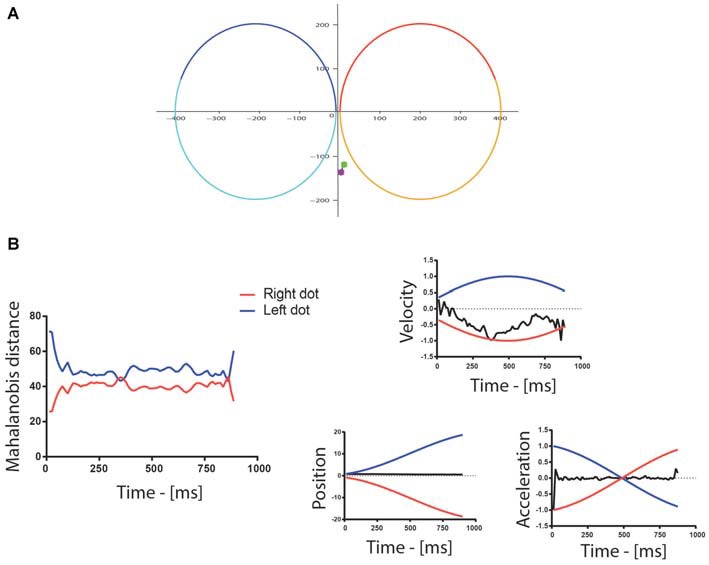
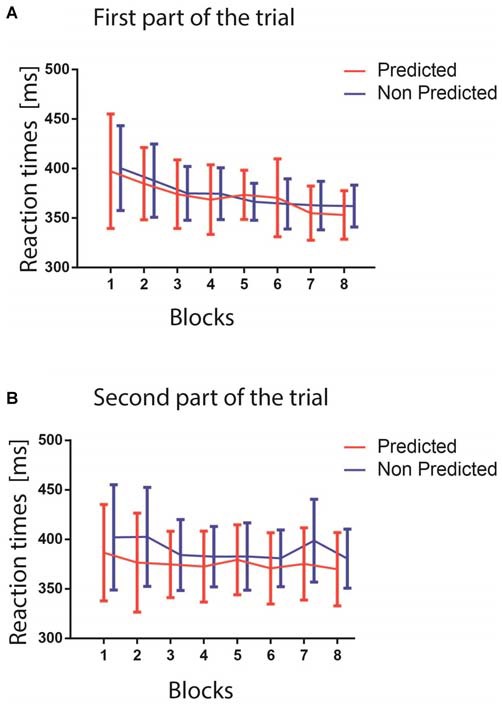
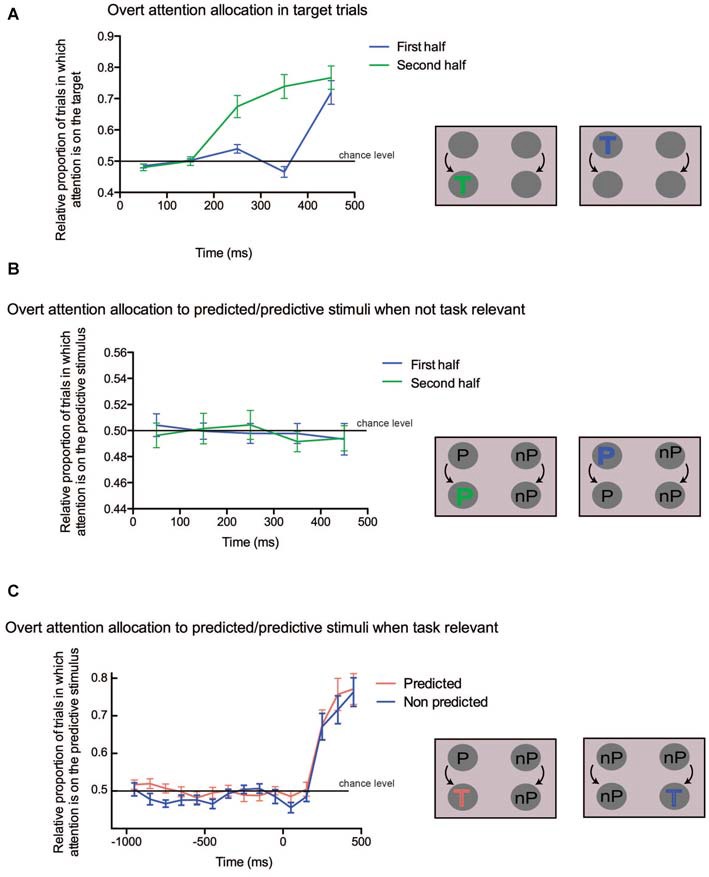
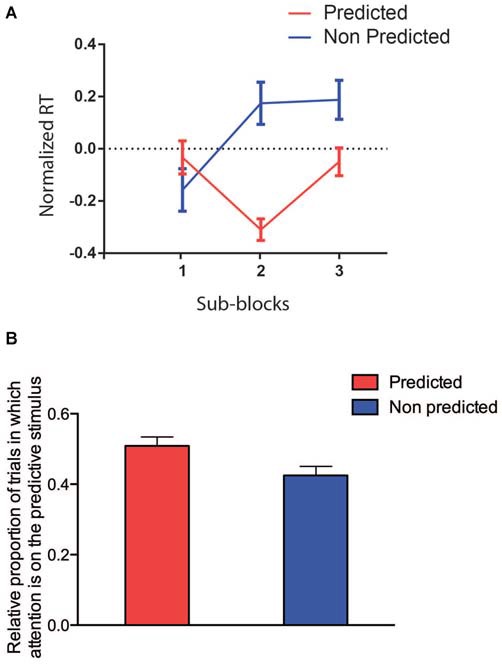
Visual attention seems essential for learning the statistical regularities in our environment, a process known as statistical learning. However, how attention is allocated when exploring a novel visual scene whose statistical structure is unknown remains unclear. In order to address this question, we investigated visual attention allocation during a task in which we manipulated the conditional probability of occurrence of colored stimuli, unbeknown to the subjects. Participants were instructed to detect a target colored dot among two dots moving along separate circular paths. We evaluated implicit statistical learning, i.e., the effect of color predictability on reaction times (RTs), and recorded eye position concurrently. Attention allocation was indexed by comparing the Mahalanobis distance between the position, velocity and acceleration of the eyes and the two colored dots. We found that learning the conditional probabilities occurred very early during the course of the experiment as shown by the fact that, starting already from the first block, predictable stimuli were detected with shorter RT than unpredictable ones. In terms of attentional allocation, we found that the predictive stimulus attracted gaze only when it was informative about the occurrence of the target but not when it predicted the occurrence of a task-irrelevant stimulus. This suggests that attention allocation was influenced by regularities only when they were instrumental in performing the task. Moreover, we found that the attentional bias towards task-relevant predictive stimuli occurred at a very early stage of learning, concomitantly with the first effects of learning on RT. In conclusion, these results show that statistical regularities capture visual attention only after a few occurrences, provided these regularities are instrumental to perform the task.

Keywords: eye tracking; implicit learning; selective attention; statistical learning; visual attention.


Figures

Figure 1
Figure 1
(A) Experimental Design. The upper part is a schematic representation of a whole trial, while the lower part of the picture represents the successive stages of a block. The dashed line represents the range of dot positions in which a change of color may occur. (B) An example of transition probabilities between colors is represented. Two colors were always associated to each other (conditional probability = 1, predictable colors) while the remaining colors all shared a conditional probability equal to 0.33 (unpredictable colors). The transition probabilities of the colors were pseudo randomized between subjects.
Figure 2
Figure 2
(A) Example of eye movements during a trial: the colored spots represent the beginning (green) and end (purple) of the eye trace. In this particular example, the position of the eyes changed little throughout the trial. The red/orange and the blue/cyan traces are the paths of the two dots for the first/second part of the trial. (B) The graph to the left shows the Mahalanobis distance between the eyes and the dots following the left (blue) and right (red) trajectories/paths in the first half of the trial. The Mahalanobis distance with the two dots was relatively large in this particular trial (around 42) because the position and acceleration profiles of the eyes differed strongly from the ones of the dots, as shown on the graphs on the right of the figure, which illustrate the normalized velocity, the position and the normalized acceleration of the dots (blue—left, red—right) and gaze (black). The position is reported in pixel, whereas the trial-wise normalization of velocity and acceleration was performed by dividing all values by the maximum of their absolute value. The velocity of the gaze, however, followed more closely the velocity of the right dot, which indicated attention allocation to the right in this example trial.
Figure 3
Figure 3
(A) The upper figure shows the reaction times (RTs) in ms for the two predictability conditions in the first part of the trials (red predicted colors, blue unpredicted colors). The blocks are represented on the x-axis. (B) The lower figure shows RTs as a function of the blocks for the second part of the trials (red predictable colors, blue unpredictable colors). In both panels, error bars represent standard errors of the mean computed within each block.
Figure 4
Figure 4
(A) Overt attention allocation for the trials in which a target occurred either in the first half (blue line) or in the second half (green line) of the trial. Time is shown along the x-axis, the proportion of trials in which targets attracted attention is on the y-axis. The 0 value on the x axis corresponds either to the beginning of the trial (first half) or to the change of color (second half). A schematic depiction of the analyzed conditions is shown on the right. The target could appear either in the first part (blue “T”) or in the second part (green “T”). (B) Overt attention allocation to predicted/predictive stimuli when not task-relevant. On the x-axis time is in ms, on the y-axis the proportion of trials in which predictive colors attracted attention is shown, indicated as the difference between the predicted and the non-predicted dots. A value of 0 on x-axis corresponds either to the beginning of the trial (first half) or to the change of color (second half). On the right, the predicted (“P”) and non predicted (“nP”) conditions are illustrated. (C) Overt attention allocation to the predicted stimulus when task relevant. On the x-axis time is in ms, while on the y-axis there is the relative proportion of trials in which attention is captured by the predictive stimulus when the target is either predictive or not. A value of 0 on the x-axis corresponds to the time of the change of color. The two conditions are illustrated on the right of the panel: in the first case the target is preceded by a predictive color (red “T”), whereas in the second case the target is preceded by a non-predictive color (blue “T”).
Figure 5
Figure 5
(A) RTs restricted to the first block (red predictable colors, blue unpredictable colors). On the x-axis, the three sub-blocks are, on the y-axis the log-transformed and normalized RTs are represented. (B) Attention allocation restricted to the first block (red predictable colors, blue unpredictable colors).

References

    1. Abla D., Okanoya K. (2009). Visual statistical learning of shape sequences: an ERP study. Neurosci. Res. 64, 185–190. 10.1016/j.neures.2009.02.013 - DOI - PubMed
    1. Ahissar M., Hochstein S. (1993). Attentional control of early perceptual learning. Proc. Natl. Acad. Sci. U S A 90, 5718–5722. 10.1073/pnas.90.12.5718 - DOI - PMC - PubMed
    1. Barakat B. K., Seitz A. R., Shams L. (2013). The effect of statistical learning on internal stimulus representations: predictable items are enhanced even when not predicted. Cognition 129, 205–211. 10.1016/j.cognition.2013.07.003 - DOI - PubMed
    1. Brady T. F., Konkle T., Alvarez G. A. (2009). Compression in visual working memory: using statistical regularities to form more efficient memory representations. J. Exp. Psychol. Gen. 138, 487–502. 10.1037/a0016797 - DOI - PubMed
    1. Brainard D. H. (1997). The psychophysics toolbox. Spat. Vis. 10, 433–436. 10.1163/156856897x00357 - DOI - PubMed

LinkOut - more resources