

Viral Regulation of Prokaryotic Carbon Metabolism in a Hypereutrophic Freshwater Reservoir Ecosystem (Villerest, France)
- PMID: 26903963
- PMCID: PMC4746248
- DOI: 10.3389/fmicb.2016.00081
Viral Regulation of Prokaryotic Carbon Metabolism in a Hypereutrophic Freshwater Reservoir Ecosystem (Villerest, France)
Abstract
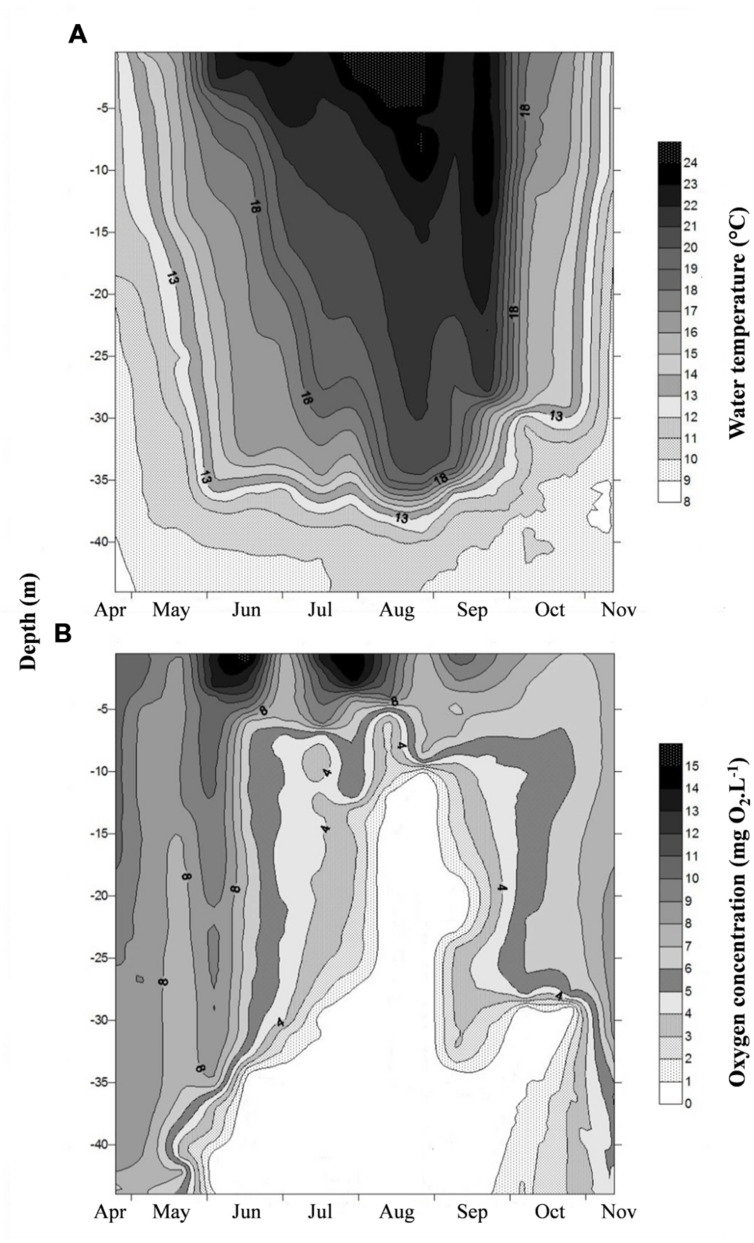
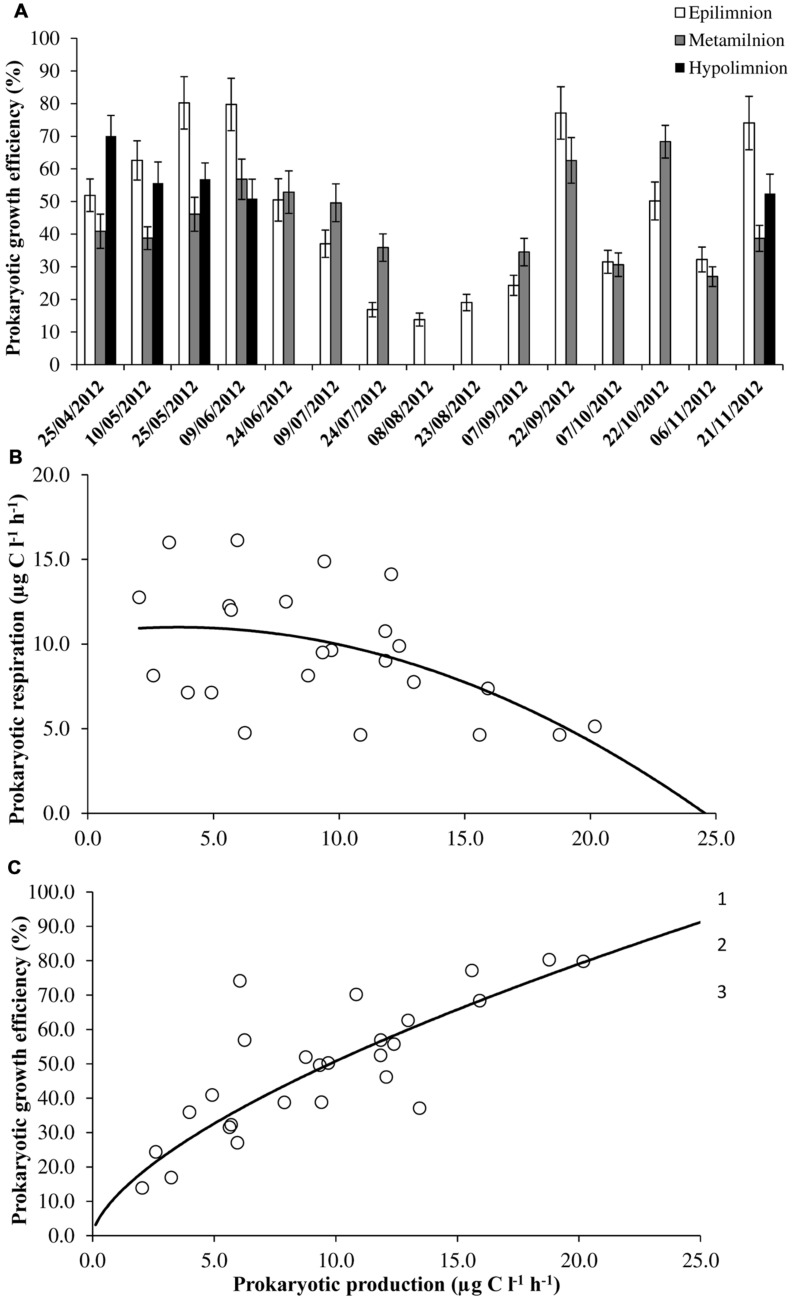
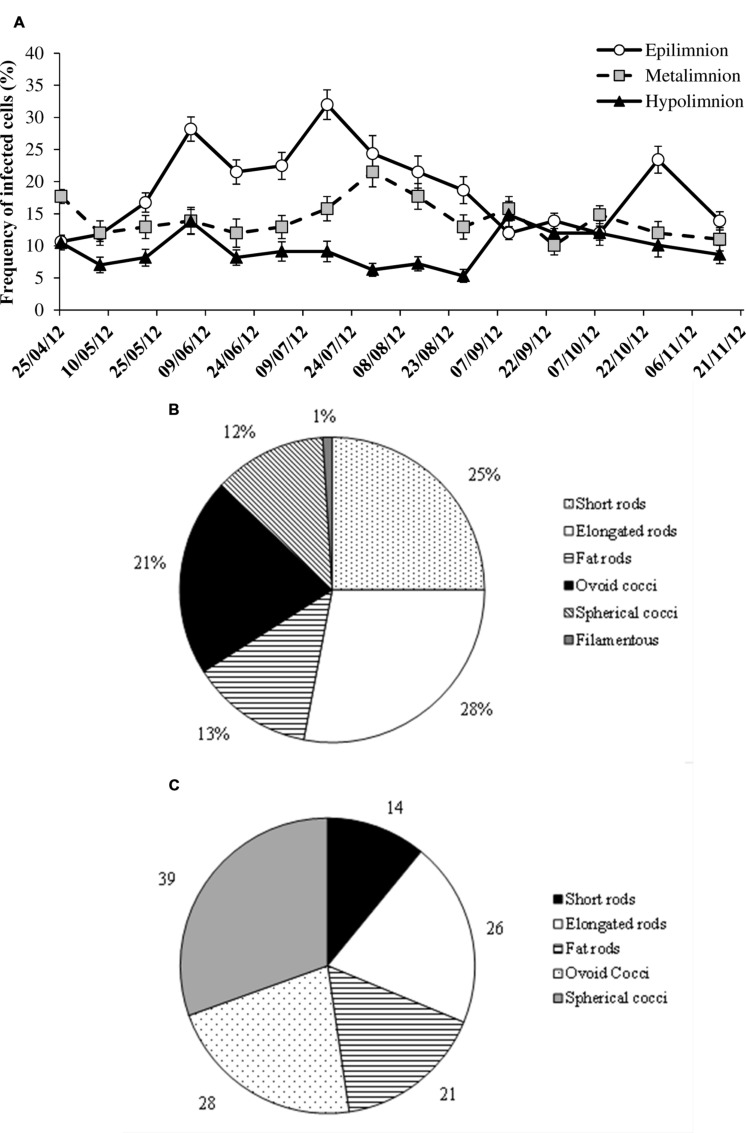
The current consensus concerning the viral regulation of prokaryotic carbon metabolism is less well-studied, compared to substrate availability. We explored the seasonal and vertical distribution of viruses and its relative influence on prokaryotic carbon metabolism in a hypereutrophic reservoir, Lake Villerest (France). Flow cytometry and transmission electron microscopy (TEM) analyses to determine viral abundance (VA; range = 6.1-63.5 × 10(7) ml(-1)) and viral infection rates of prokaryotes (range = 5.3-32%) respectively suggested that both the parameters varied more significantly with depths than with seasons. Prokaryotic growth efficiency (PGE, considered as a proxy of prokaryotic carbon metabolism) calculated from prokaryotic production and respiration measurements (PGE = prokaryotic production/[prokaryotic production + prokaryotic respiration] × 100) varied from 14 to 80% across seasons and depths. Viruses through selective lyses had antagonistic impacts on PGE by regulating key prokaryotic metabolic processes (i.e., production and respiration). Higher viral lysis accompanied by higher respiration rates and lower PGE in the summer (mean = 22.9 ± 10.3%) than other seasons (mean = 59.1 ± 18.6%), led to significant loss of carbon through bacterial-viral loop and shifted the reservoir system to net heterotrophy. Our data therefore suggests that the putative adverse impact of viruses on the growth efficiency of the prokaryotic community can have strong implications on nutrient flux patterns and on the overall ecosystem metabolism in anthropogenic dominated aquatic systems such as Lake Villerest.
Keywords: Villerest reservoir; lytic infection; prokaryotes; prokaryotic growth efficiency; seasonal dynamics; viruses.
Figures


Similar articles
-
Viral and grazer regulation of prokaryotic growth efficiency in temperate freshwater pelagic environments.FEMS Microbiol Ecol. 2015 Feb;91(2):1-12. doi: 10.1093/femsec/fiv002. Epub 2015 Jan 11. FEMS Microbiol Ecol. 2015. PMID: 25764557
-
Variable viral and grazer control of prokaryotic growth efficiency in temperate freshwater lakes (French Massif Central).Microb Ecol. 2013 Nov;66(4):906-16. doi: 10.1007/s00248-013-0289-x. Epub 2013 Sep 24. Microb Ecol. 2013. PMID: 24061344
-
Functional responses of prokaryotes and viruses to grazer effects and nutrient additions in freshwater microcosms.ISME J. 2008 May;2(5):498-509. doi: 10.1038/ismej.2008.15. Epub 2008 Feb 14. ISME J. 2008. PMID: 18273065
-
Deciphering the virus-to-prokaryote ratio (VPR): insights into virus-host relationships in a variety of ecosystems.Biol Rev Camb Philos Soc. 2017 May;92(2):1081-1100. doi: 10.1111/brv.12271. Epub 2016 Apr 26. Biol Rev Camb Philos Soc. 2017. PMID: 27113012 Review.
-
Gross primary production controls the subsequent winter CO2 exchange in a boreal peatland.Glob Chang Biol. 2016 Dec;22(12):4028-4037. doi: 10.1111/gcb.13308. Epub 2016 May 12. Glob Chang Biol. 2016. PMID: 27038205 Review.
Cited by
-
Impact of Top-Down Regulation on the Growth Efficiency of Freshwater Bacterioplankton.Microorganisms. 2024 Oct 15;12(10):2061. doi: 10.3390/microorganisms12102061. Microorganisms. 2024. PMID: 39458370 Free PMC article.
-
Top-Down Controls of Bacterial Metabolism: A Case Study from a Temperate Freshwater Lake Ecosystem.Microorganisms. 2022 Mar 25;10(4):715. doi: 10.3390/microorganisms10040715. Microorganisms. 2022. PMID: 35456766 Free PMC article.
-
Taxonomical Resolution and Distribution of Bacterioplankton Along the Vertical Gradient Reveals Pronounced Spatiotemporal Patterns in Contrasted Temperate Freshwater Lakes.Microb Ecol. 2018 Aug;76(2):372-386. doi: 10.1007/s00248-018-1143-y. Epub 2018 Jan 16. Microb Ecol. 2018. PMID: 29340714
References
-
- APHA (1998). Standard Methods for the Examination of Water and Wastewater, 20th Edn Washington, DC: American Public Health Association.
-
- Binder B. (1999). Reconsidering the relationship between virally induced bacterial mortality and frequency of infected cells. Aquat. Microb. Ecol. 18 207–215. 10.3354/ame018207 - DOI
-
- Bohannan B. J. M., Lenski R. E. (2000). Linking genetic change to community evolution: insights from studies of bacteria and bacteriophage. Ecol. Lett. 3 362–377. 10.1046/j.1461-0248.2000.00161.x - DOI
-
- Bonilla-Findji O., Malits A., Fefèvre D., Rochelle-Newall E., Lemée R., Weinbauer M. G., et al. (2008). Viral effects on bacterial respiration, production and growth efficiency: consistent trends in the Southern Ocean and Mediterranean Sea. Deep Sea Res. Part II 55 790–800. 10.1016/j.dsr2.2007.12.004 - DOI
LinkOut - more resources
Full Text Sources
Other Literature Sources