Short-Term Rhizosphere Effect on Available Carbon Sources, Phenanthrene Degradation, and Active Microbiome in an Aged-Contaminated Industrial Soil
- PMID: 26903971
- PMCID: PMC4742875
- DOI: 10.3389/fmicb.2016.00092
Short-Term Rhizosphere Effect on Available Carbon Sources, Phenanthrene Degradation, and Active Microbiome in an Aged-Contaminated Industrial Soil
Abstract
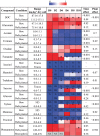
Over the last decades, understanding of the effects of plants on soil microbiomes has greatly advanced. However, knowledge on the assembly of rhizospheric communities in aged-contaminated industrial soils is still limited, especially with regard to transcriptionally active microbiomes and their link to the quality or quantity of carbon sources. We compared the short-term (2-10 days) dynamics of bacterial communities and potential PAH-degrading bacteria in bare or ryegrass-planted aged-contaminated soil spiked with phenanthrene, put in relation with dissolved organic carbon (DOC) sources and polycyclic aromatic hydrocarbon (PAH) pollution. Both resident and active bacterial communities (analyzed from DNA and RNA, respectively) showed higher species richness and smaller dispersion between replicates in planted soils. Root development strongly favored the activity of Pseudomonadales within the first 2 days, and of members of Actinobacteria, Caulobacterales, Rhizobiales, and Xanthomonadales within 6-10 days. Plants slowed down the dissipation of phenanthrene, while root exudation provided a cocktail of labile substrates that might preferentially fuel microbial growth. Although the abundance of PAH-degrading genes increased in planted soil, their transcription level stayed similar to bare soil. In addition, network analysis revealed that plants induced an early shift in the identity of potential phenanthrene degraders, which might influence PAH dissipation on the long-term.
Keywords: DNA/RNA; PAH; bacterial diversity; plant root exudates; rhizosphere; ryegrass (Lolium).
Figures


Similar articles
-
Stable isotope probing and metagenomics highlight the effect of plants on uncultured phenanthrene-degrading bacterial consortium in polluted soil.ISME J. 2019 Jul;13(7):1814-1830. doi: 10.1038/s41396-019-0394-z. Epub 2019 Mar 14. ISME J. 2019. PMID: 30872807 Free PMC article.
-
Impact of clay mineral, wood sawdust or root organic matter on the bacterial and fungal community structures in two aged PAH-contaminated soils.Environ Sci Pollut Res Int. 2015 Sep;22(18):13724-38. doi: 10.1007/s11356-015-4117-3. Epub 2015 Jan 25. Environ Sci Pollut Res Int. 2015. PMID: 25616383
-
Root exudates modify bacterial diversity of phenanthrene degraders in PAH-polluted soil but not phenanthrene degradation rates.Environ Microbiol. 2011 Mar;13(3):722-36. doi: 10.1111/j.1462-2920.2010.02376.x. Epub 2010 Nov 18. Environ Microbiol. 2011. PMID: 21087382
-
High PAH degradation and activity of degrading bacteria during alfalfa growth where a contrasted active community developed in comparison to unplanted soil.Environ Sci Pollut Res Int. 2018 Oct;25(29):29556-29571. doi: 10.1007/s11356-018-2744-1. Epub 2018 Aug 22. Environ Sci Pollut Res Int. 2018. PMID: 30136188
-
The rhizosphere microbiome: Significance in rhizoremediation of polyaromatic hydrocarbon contaminated soil.J Environ Manage. 2018 Jul 1;217:858-870. doi: 10.1016/j.jenvman.2018.04.022. Epub 2018 Apr 24. J Environ Manage. 2018. PMID: 29660711 Review.
Cited by
-
Taxonomic and functional trait-based approaches suggest that aerobic and anaerobic soil microorganisms allow the natural attenuation of oil from natural seeps.Sci Rep. 2022 May 4;12(1):7245. doi: 10.1038/s41598-022-10850-4. Sci Rep. 2022. PMID: 35508504 Free PMC article.
-
Rhizosphere Bacteria in Plant Growth Promotion, Biocontrol, and Bioremediation of Contaminated Sites: A Comprehensive Review of Effects and Mechanisms.Int J Mol Sci. 2021 Sep 29;22(19):10529. doi: 10.3390/ijms221910529. Int J Mol Sci. 2021. PMID: 34638870 Free PMC article.
-
The Utility of Electrochemical Systems in Microbial Degradation of Polycyclic Aromatic Hydrocarbons: Discourse, Diversity and Design.Front Microbiol. 2020 Oct 23;11:557400. doi: 10.3389/fmicb.2020.557400. eCollection 2020. Front Microbiol. 2020. PMID: 33193139 Free PMC article. Review.
-
Rhizocompartments and environmental factors affect microbial composition and variation in native plants.J Microbiol. 2019 Jul;57(7):550-561. doi: 10.1007/s12275-019-8646-1. Epub 2019 Jun 27. J Microbiol. 2019. PMID: 31073895
-
pH is the primary determinant of the bacterial community structure in agricultural soils impacted by polycyclic aromatic hydrocarbon pollution.Sci Rep. 2017 Jan 4;7:40093. doi: 10.1038/srep40093. Sci Rep. 2017. PMID: 28051171 Free PMC article.
References
-
- Aprill W., Sims R. C. (1990). Evaluation of the use of prairie grasses for stimulating polycyclic aromatic hydrocarbon treatment in soil. Chemosphere 20, 253–265. 10.1016/0045-6535(90)90100-8 - DOI
-
- Balkwill D. L., Drake G. R., Reeves R. H., Fredrickson J. K., White D. C., Ringelberg D. B., et al. (1997). Taxonomic study of aromatic-degrading bacteria from deep-terrestrial-subsurface sediments and description of Sphingomonas aromaticivorans sp. nov., Sphingomonas subterranea sp. nov., and Sphingomonas stygia sp. nov. Int. J. Syst. Bacteriol. 47, 191–201. 10.1099/00207713-47-1-191 - DOI - PubMed
-
- Balland C., Poszwa A., Leyval C., Mustin C. (2010). Dissolution rates of phyllosilicates as a function of bacterial metabolic diversity. Geochim. Cosmochim. Acta 74, 5478–5493. 10.1016/j.gca.2010.06.022 - DOI
LinkOut - more resources
Full Text Sources
Other Literature Sources

