. 2016 Feb 8:7:118.
doi: 10.3389/fmicb.2016.00118. eCollection 2016.

PATtyFams: Protein Families for the Microbial Genomes in the PATRIC Database

Affiliations

PATtyFams: Protein Families for the Microbial Genomes in the PATRIC Database

James J Davis et al. Front Microbiol. .

Abstract

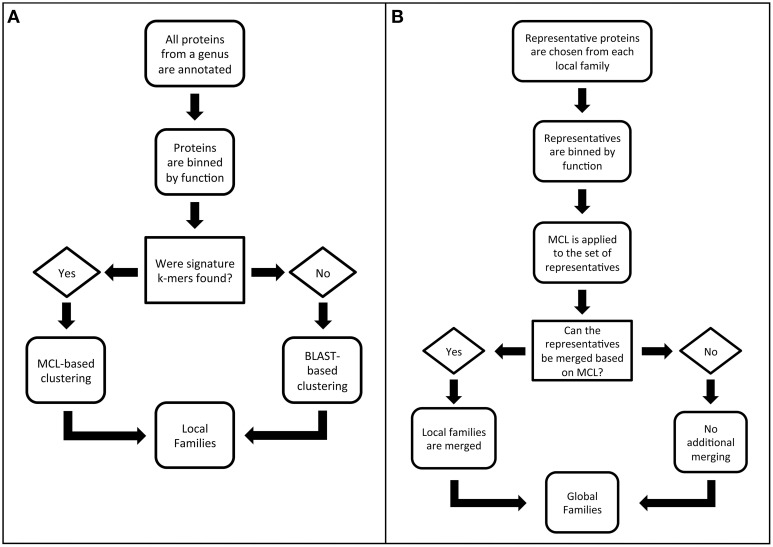
The ability to build accurate protein families is a fundamental operation in bioinformatics that influences comparative analyses, genome annotation, and metabolic modeling. For several years we have been maintaining protein families for all microbial genomes in the PATRIC database (Pathosystems Resource Integration Center, patricbrc.org) in order to drive many of the comparative analysis tools that are available through the PATRIC website. However, due to the burgeoning number of genomes, traditional approaches for generating protein families are becoming prohibitive. In this report, we describe a new approach for generating protein families, which we call PATtyFams. This method uses the k-mer-based function assignments available through RAST (Rapid Annotation using Subsystem Technology) to rapidly guide family formation, and then differentiates the function-based groups into families using a Markov Cluster algorithm (MCL). This new approach for generating protein families is rapid, scalable and has properties that are consistent with alignment-based methods.

Keywords: FIGfams; RAST; comparative genomics; genome annotation; metabolic modeling.


Figures

Figure 1
Figure 1
Flow diagrams outlining the PATtyFam generation procedure for (A) local families and (B) global families.
Figure 2
Figure 2
Protein family sizes. Histograms depict the number of protein families vs. the number of family members. Protein families were generated with PATtyFams (blue bars), FIGfams (red bars), kClust (orange bars), and OrthoMCL (green bars). The first row (A–C) shows families generated for the 43 Brucella genomes. The second row (D–F) shows families generated for the 38 Escherichia genomes. The third row shows families generated for the 80 diverse genomes. Note that the scale of the Y-axis changes and is shown in log-scale for (G–I).
Figure 3
Figure 3
Venn diagrams showing the number of identical protein families held in common between PATtyFams (blue), OrthoMCL (yellow), kClust (green), and FIGfams (red) for (A) the 43 Brucella genomes, (B) the 38 Escherichia genomes, and (C) the 80 diverse genomes. Data are shown for core protein families, defined as those families that have proteins from ≥90% of genomes in each set.
Figure 4
Figure 4
Median percent identity among family members. Histograms depict the number of protein families vs. the median percent identity for all pairwise BLAST comparisons between family members for (A) the 43 Brucella genomes, (B) the 38 Escherichia genomes, and (C) the 80 diverse genomes. Families generated by FIGfams are depicted as red lines with square plot points, kClust are orange lines with diamond plot points, OrthoMCL are green lines with triangle plot points, and PATtyFams are blue lines with circle plot points.
Figure 5
Figure 5
Conservation of protein domains within family members. Histograms depict the total number of protein domains vs. their conservation across all members of each family as generated by FIGfams (red), kClust (orange), OrthoMCL (green), and PATtyFams (blue). Data are shown for the subset of families in which ≥ 90% of the genomes are represented for (A) the 43 Brucella genomes, (B) the 38 Escherichia genomes, and (C) the 80 diverse genomes.
Figure 6
Figure 6
Chromosomal context conservation within family members. For the protein-encoding gene of each family member, the functions of its neighboring genes 5 kbp upstream, and downstream were obtained. Histograms depict the total number of functions vs. their conservation among family members. Data for families generated by FIGfams are shown in red, kClust are orange, OrthoMCL are green, and PATtyFams are blue. Data are shown for the subset of protein families in which ≥90% of the genomes are represented for (A) the 43 Brucella genomes, (B) the 38 Escherichia genomes, and (C) the 80 diverse genomes. Note that the number of proteins in the 0.1 bin is not displayed for the 80 diverse genomes and is 96,117 for FIGfams, 5540 for kClust, 75,070 for OrthoMCL, and 55,525 for PATtyFams.

References

    1. Aziz R. K., Bartels D., Best A. A., Dejongh M., Disz T., Edwards R. A., et al. . (2008). The RAST Server: rapid annotations using subsystems technology. BMC Genomics 9:75. 10.1186/1471-2164-9-75 - DOI - PMC - PubMed
    1. Benedict M. N., Mundy M. B., Henry C. S., Chia N., Price N. D. (2014). Likelihood-based gene annotations for gap filling and quality assessment in genome-scale metabolic models. PLoS Comput. Biol. 10:e1003882. 10.1371/journal.pcbi.1003882 - DOI - PMC - PubMed
    1. Benson D. A., Cavanaugh M., Clark K., Karsch-Mizrachi I., Lipman D. J., Ostell J., et al. . (2013). GenBank. Nucleic Acids Res. 41, D36–D42. 10.1093/nar/gks1195 - DOI - PMC - PubMed
    1. Bentley S., Chater K., Cerdeno-Tarraga A.-M., Challis G., Thomson N., James K., et al. . (2002). Complete genome sequence of the model actinomycete Streptomyces coelicolor A3 (2). Nature 417, 141–147. 10.1038/417141a - DOI - PubMed
    1. Brettin T., Davis J. J., Disz T., Edwards R. A., Gerdes S., Olsen G. J., et al. . (2015). RASTtk: a modular and extensible implementation of the RAST algorithm for building custom annotation pipelines and annotating batches of genomes. Sci. Rep. 5:8365. 10.1038/srep08365 - DOI - PMC - PubMed