

Maize Plant Resilience to N Stress and Post-silking N Capacity Changes over Time: A Review
- PMID: 26904038
- PMCID: PMC4746326
- DOI: 10.3389/fpls.2016.00053
Maize Plant Resilience to N Stress and Post-silking N Capacity Changes over Time: A Review
Abstract
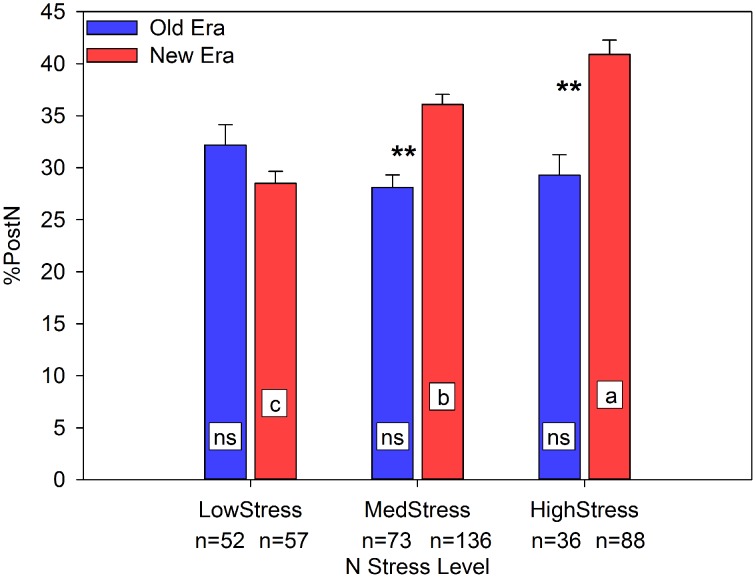
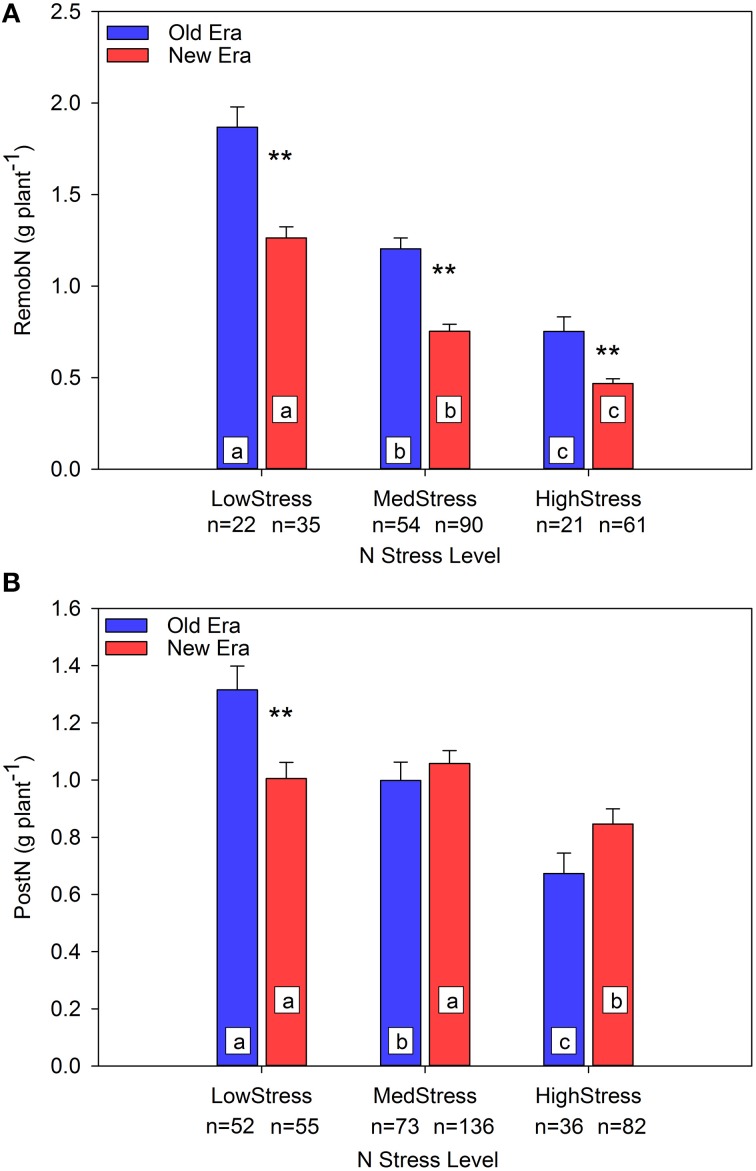
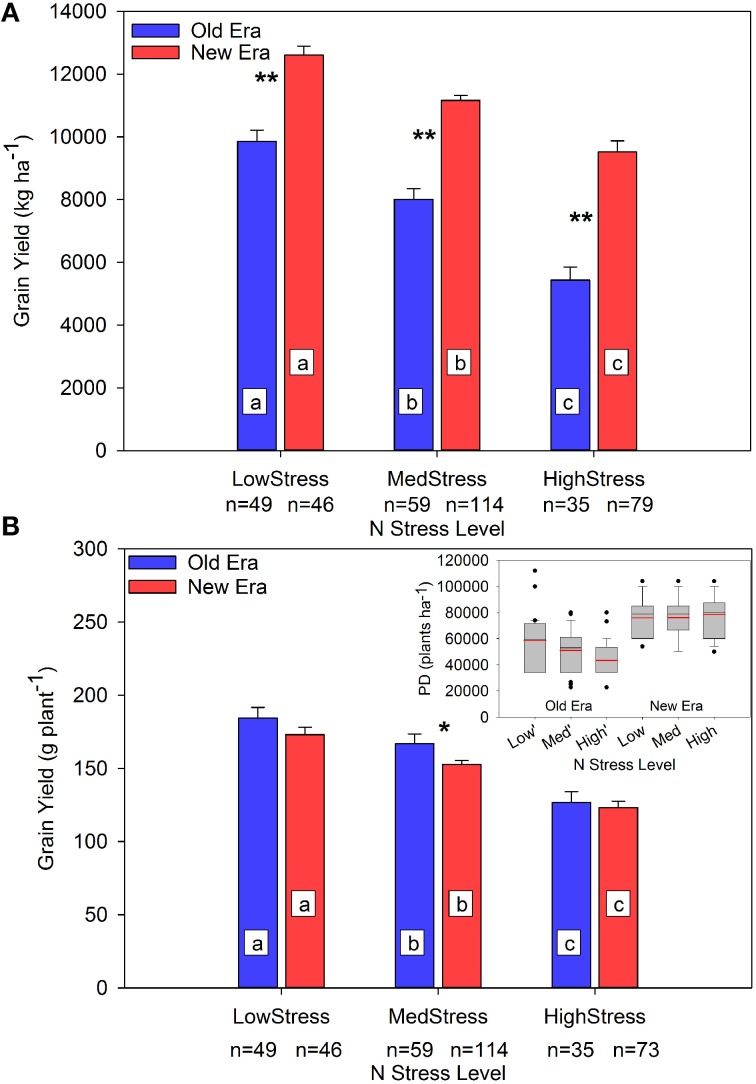
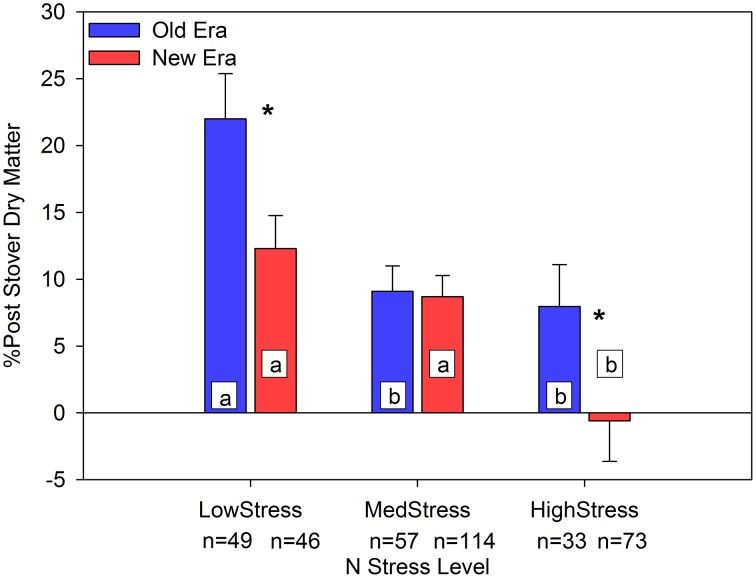
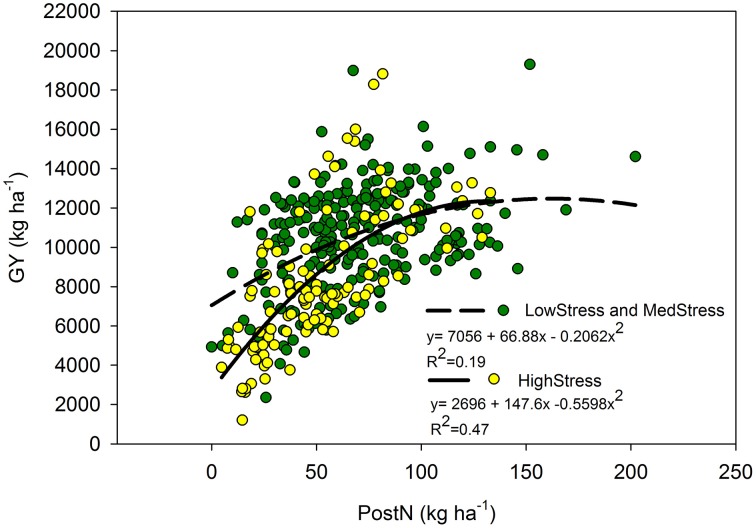
We conducted a synthesis analysis on data from 86 published field experiments conducted from 1903 to 2014 to explore the specific consequences of post-silking N accumulation (PostN) in New Era vs. Old Era hybrids on grain yield (GY) and recovery from plant N stress at flowering (R1 stage). The Old Era encompassed studies using genotypes released before, and including, 1990 and the New Era included all studies using genotypes released from 1991 to 2014. Mean N fertilizer rates for experiments in the Old and New Era were similar (170 and 172 kg ha(-1), respectively), but plant densities averaged 5.0 plants m(-2) in the Old Era vs. 7.3 plants m(-2) in the New Era studies. Whole-plant N stress at R1 for each hybrid, environment and management combination was ranked into one of three categories relative to the N Nutrition Index (NNI). The key findings from this analysis are: (i) New Era genotypes increased the proportion of the total plant N at maturity accumulated post-silking (%PostN) as N stress levels at R1 increased-demonstrating improved adaptability to low N environments, (ii) New Era hybrids maintained similar GY on a per plant basis under both low and high N stress at R1 despite being subject to much higher population stress, (iii) PostN is more strongly correlated to GY (both eras combined) when under severe R1 N stress than under less acute N stress at R1, (iv) the New Era accumulated more total N (an increase of 30 kg N ha(-1)) and higher %PostN (an increase from 30% in Old to 36% in New Era), and (v) the change in stover dry weight from silking to physiological maturity (ΔStover) has a positive, linear relationship with PostN in the Old Era but less so in the New Era. This increased understanding of how modern genotypes accumulate more N in the reproductive stage and have more PostN and GY resilience to mid-season N stress, even when grown at much higher plant densities, will assist trait selection and N management research directed to improving maize yields and N efficiencies simultaneously.
Keywords: genotype era; maize; nitrogen nutrition index; nitrogen stress tolerance; post-silking nitrogen.
Figures
Similar articles
-
Post-silking Factor Consequences for N Efficiency Changes Over 38 Years of Commercial Maize Hybrids.Front Plant Sci. 2017 Oct 11;8:1737. doi: 10.3389/fpls.2017.01737. eCollection 2017. Front Plant Sci. 2017. PMID: 29075274 Free PMC article.
-
Which plant traits are most strongly related to post-silking nitrogen uptake in maize under water and/or nitrogen stress?J Plant Physiol. 2020 Jan;244:153059. doi: 10.1016/j.jplph.2019.153059. Epub 2019 Nov 2. J Plant Physiol. 2020. PMID: 31775101
-
Luxury Vegetative Nitrogen Uptake in Maize Buffers Grain Yield Under Post-silking Water and Nitrogen Stress: A Mechanistic Understanding.Front Plant Sci. 2019 Mar 26;10:318. doi: 10.3389/fpls.2019.00318. eCollection 2019. Front Plant Sci. 2019. PMID: 30972083 Free PMC article.
-
A high plant density reduces the ability of maize to use soil nitrogen.PLoS One. 2017 Feb 24;12(2):e0172717. doi: 10.1371/journal.pone.0172717. eCollection 2017. PLoS One. 2017. PMID: 28234970 Free PMC article.
-
A new era in plant pathology in Japan: incorporation of the Phytopathological Society of Japan and research reform directed by genomic studies.J Gen Plant Pathol. 2020;86(6):519-522. doi: 10.1007/s10327-020-00957-9. Epub 2020 Oct 12. J Gen Plant Pathol. 2020. PMID: 33071559 Free PMC article. Review. No abstract available.
Cited by
-
Determining optimal mulching, planting density, and nitrogen application to increase maize grain yield and nitrogen translocation efficiency in Northwest China.BMC Plant Biol. 2020 Jun 19;20(1):282. doi: 10.1186/s12870-020-02477-2. BMC Plant Biol. 2020. PMID: 32560674 Free PMC article.
-
Optimized Fertilization Practices Improved Rhizosphere Soil Chemical and Bacterial Properties and Fresh Waxy Maize Yield.Metabolites. 2022 Oct 1;12(10):935. doi: 10.3390/metabo12100935. Metabolites. 2022. PMID: 36295837 Free PMC article.
-
Applicability of a "Multi-Stage Pulse Labeling" 15N Approach to Phenotype N Dynamics in Maize Plant Components during the Growing Season.Front Plant Sci. 2017 Aug 4;8:1360. doi: 10.3389/fpls.2017.01360. eCollection 2017. Front Plant Sci. 2017. PMID: 28824689 Free PMC article.
-
Effect of intermittent shade on nitrogen dynamics assessed by 15N trace isotopes, enzymatic activity and yield of Brassica napus L.Front Plant Sci. 2022 Nov 16;13:1037632. doi: 10.3389/fpls.2022.1037632. eCollection 2022. Front Plant Sci. 2022. PMID: 36466283 Free PMC article.
-
Simultaneous gains in grain yield and nitrogen efficiency over 70 years of maize genetic improvement.Sci Rep. 2019 Jun 24;9(1):9095. doi: 10.1038/s41598-019-45485-5. Sci Rep. 2019. PMID: 31235885 Free PMC article.
References
-
- Akintoye H. A., Lucas E. O., Kling J. G. (1999). Grain yield and yield components of single, double, and synthetic maize lines grown at four N levels in three ecological zones of West Africa. Trop. Agric. 76, 51–56.
-
- Anderson E. L., Kamprath E. J., Moll R. H. (1985). Prolificacy and N fertilizer effects on yield and N utilization in maize. Crop Sci. 25, 598 10.2135/cropsci1985.0011183X002500040005x - DOI
-
- Beauchamp E. G., Kannenberg L. W., Hunter R. B. (1976). Nitrogen accumulation and translocation in corn genotypes following silking. Agron. J. 68, 418 10.2134/agronj1976.00021962006800020055x - DOI
-
- Below F. E. (2002). Nitrogen metabolism and crop productivity in Handbook of Plant and Crop Physiology, 2nd Edn., ed Pessarakli M. (New York, NY: Marcel Dekker, Inc.), 385–406.
Publication types
LinkOut - more resources
Full Text Sources
Other Literature Sources
Research Materials
Miscellaneous