

Glutathione S-Transferase Gene Family in Gossypium raimondii and G. arboreum: Comparative Genomic Study and their Expression under Salt Stress
- PMID: 26904090
- PMCID: PMC4751282
- DOI: 10.3389/fpls.2016.00139
Glutathione S-Transferase Gene Family in Gossypium raimondii and G. arboreum: Comparative Genomic Study and their Expression under Salt Stress
Abstract
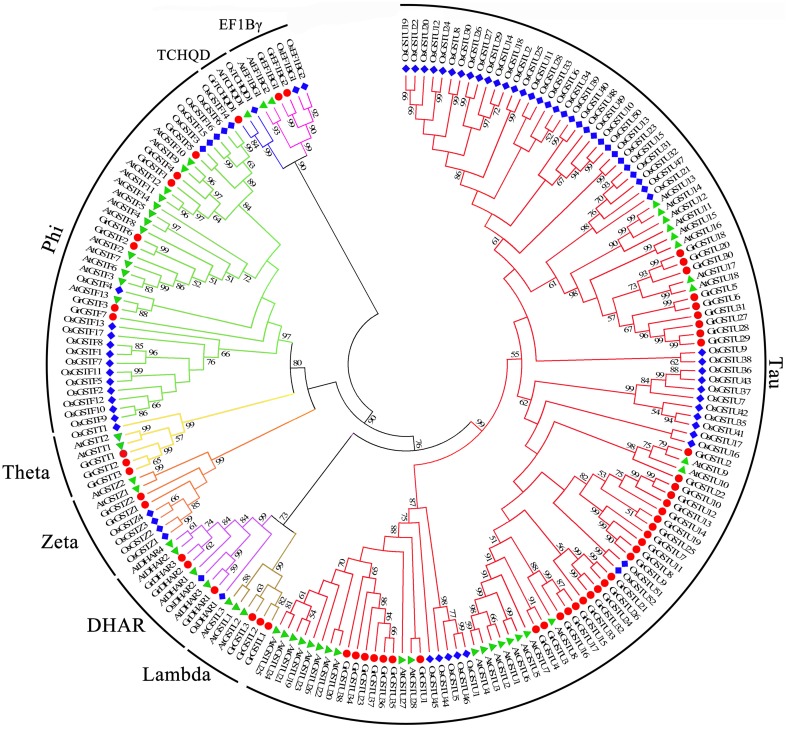
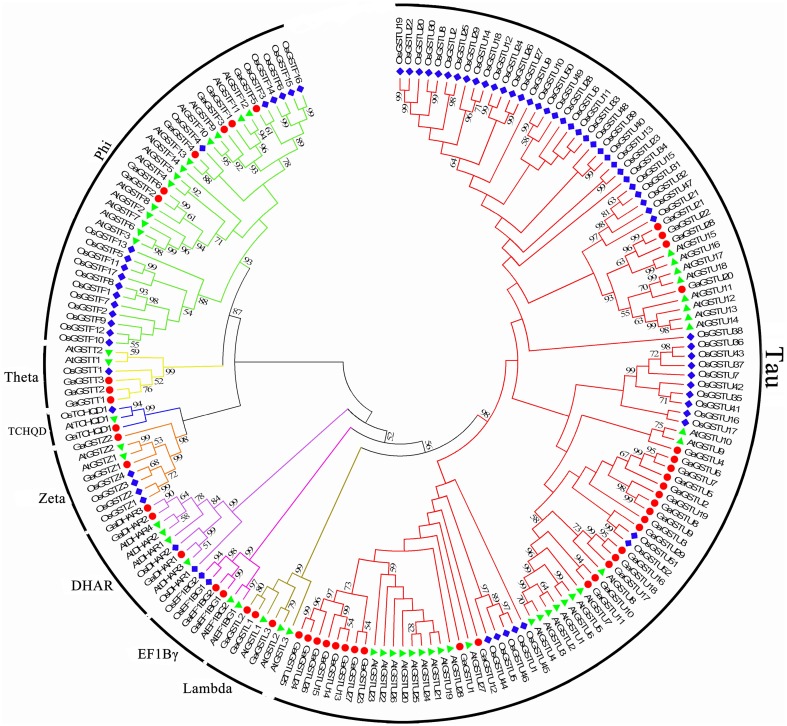
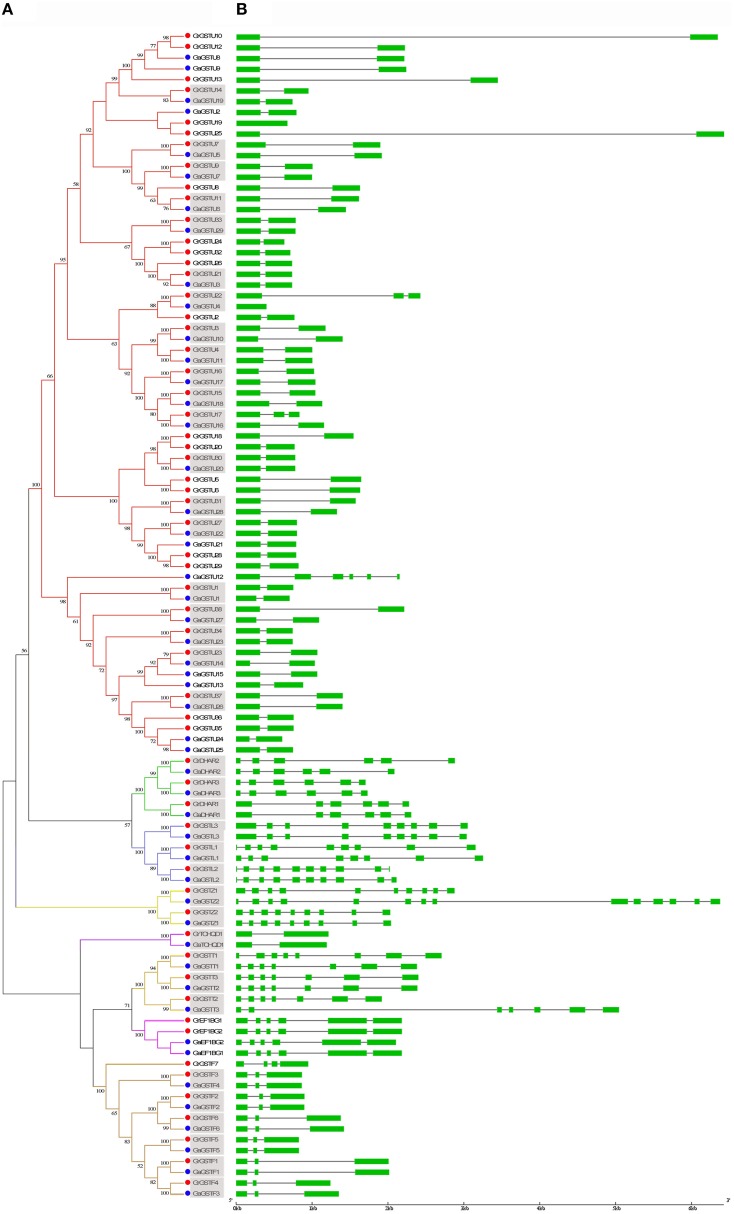
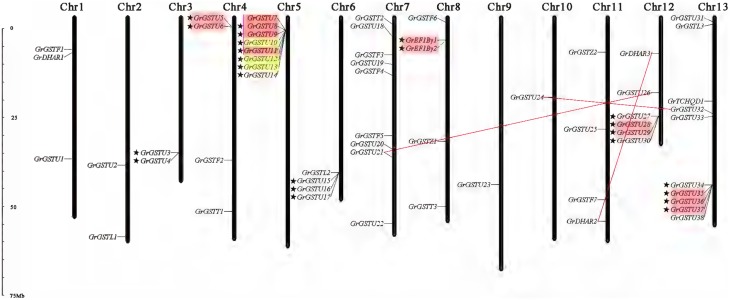
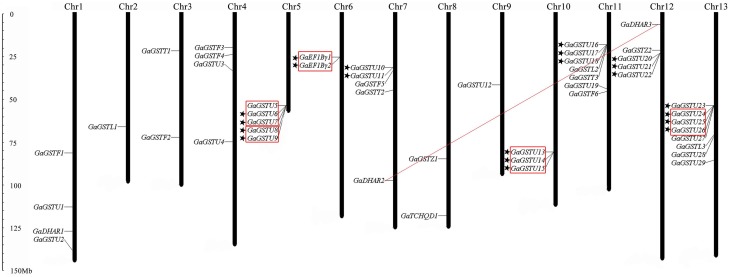
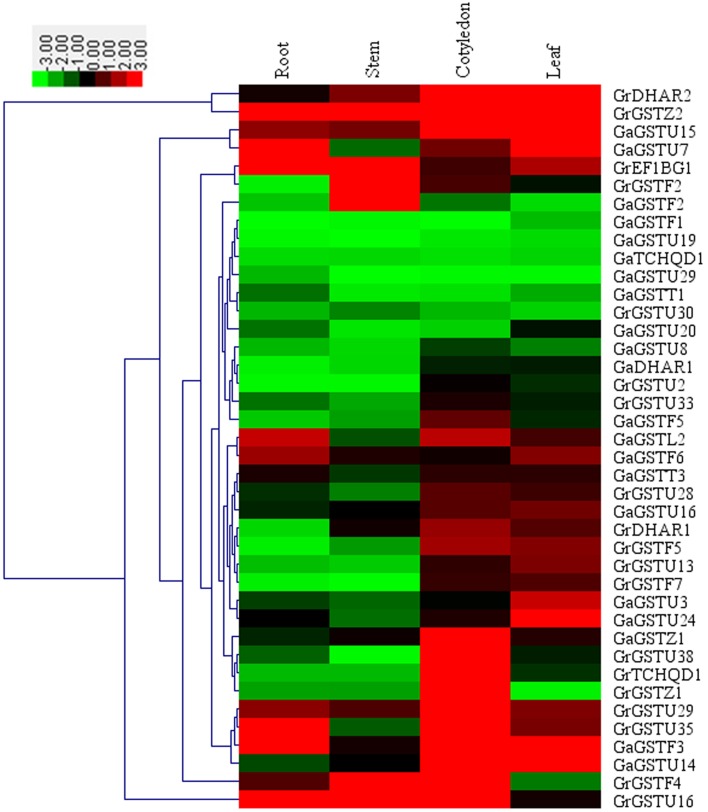
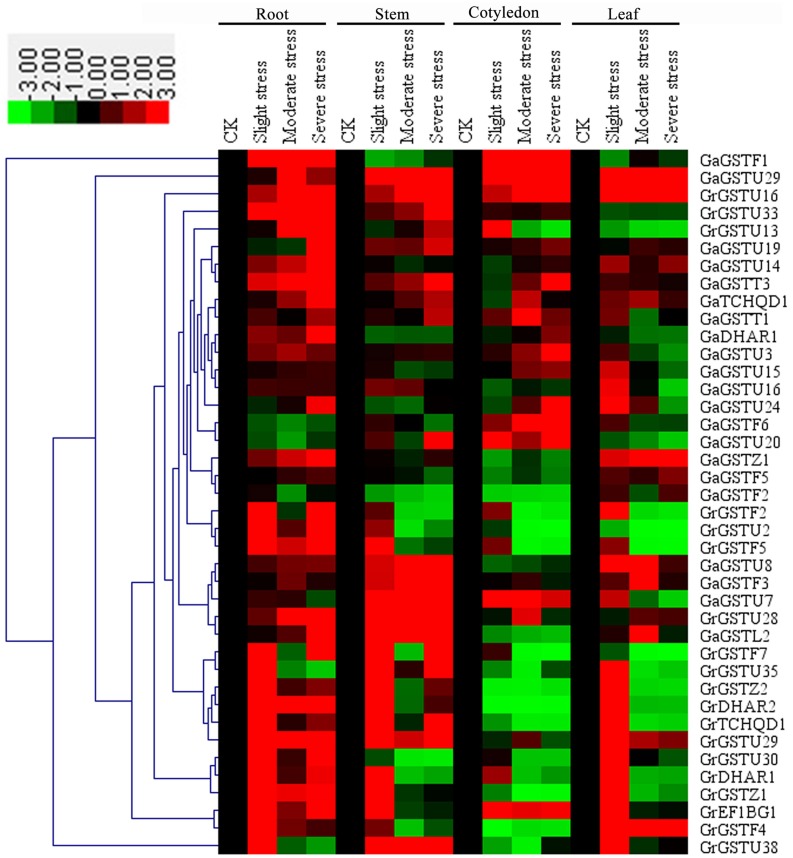
Glutathione S-transferases (GSTs) play versatile functions in multiple aspects of plant growth and development. A comprehensive genome-wide survey of this gene family in the genomes of G. raimondii and G. arboreum was carried out in this study. Based on phylogenetic analyses, the GST gene family of both two diploid cotton species could be divided into eight classes, and approximately all the GST genes within the same subfamily shared similar gene structure. Additionally, the gene structures between the orthologs were highly conserved. The chromosomal localization analyses revealed that GST genes were unevenly distributed across the genome in both G. raimondii and G. arboreum. Tandem duplication could be the major driver for the expansion of GST gene families. Meanwhile, the expression analysis for the selected 40 GST genes showed that they exhibited tissue-specific expression patterns and their expression were induced or repressed by salt stress. Those findings shed lights on the function and evolution of the GST gene family in Gossypium species.
Keywords: GST; cotton; gene family; phylogenetic analysis; salt stress.
Figures
Similar articles
-
Genome-wide analysis of the MADS-box gene family in polyploid cotton (Gossypium hirsutum) and in its diploid parental species (Gossypium arboreum and Gossypium raimondii).Plant Physiol Biochem. 2018 Jun;127:169-184. doi: 10.1016/j.plaphy.2018.03.019. Epub 2018 Mar 20. Plant Physiol Biochem. 2018. PMID: 29604523
-
Genome-Wide Analysis of Multidrug and Toxic Compound Extrusion (MATE) Family in Gossypium raimondii and Gossypium arboreum and Its Expression Analysis Under Salt, Cadmium, and Drought Stress.G3 (Bethesda). 2018 Jul 2;8(7):2483-2500. doi: 10.1534/g3.118.200232. G3 (Bethesda). 2018. PMID: 29794162 Free PMC article.
-
Genome-wide comparative analysis of NBS-encoding genes in four Gossypium species.BMC Genomics. 2017 Apr 12;18(1):292. doi: 10.1186/s12864-017-3682-x. BMC Genomics. 2017. PMID: 28403834 Free PMC article.
-
Genome-wide comparison of AP2/ERF superfamily genes between Gossypium arboreum and G. raimondii.Genet Mol Res. 2016 Jul 29;15(3). doi: 10.4238/gmr.15038211. Genet Mol Res. 2016. PMID: 27525884
-
Genome-wide in silico identification of glutathione S-transferase (GST) gene family members in fig (Ficus carica L.) and expression characteristics during fruit color development.PeerJ. 2023 Jan 25;11:e14406. doi: 10.7717/peerj.14406. eCollection 2023. PeerJ. 2023. PMID: 36718451 Free PMC article. Review.
Cited by
-
Association of glutathione S-transferase T1, M1, and P1 polymorphisms in the breast cancer risk: a meta-analysis.Ther Clin Risk Manag. 2016 May 12;12:763-9. doi: 10.2147/TCRM.S104339. eCollection 2016. Ther Clin Risk Manag. 2016. PMID: 27274261 Free PMC article.
-
Genome-Scale Analysis of the WRI-Like Family in Gossypium and Functional Characterization of GhWRI1a Controlling Triacylglycerol Content.Front Plant Sci. 2018 Oct 16;9:1516. doi: 10.3389/fpls.2018.01516. eCollection 2018. Front Plant Sci. 2018. PMID: 30386365 Free PMC article.
-
Evolution and Stress Responses of Gossypium hirsutum SWEET Genes.Int J Mol Sci. 2018 Mar 8;19(3):769. doi: 10.3390/ijms19030769. Int J Mol Sci. 2018. PMID: 29517986 Free PMC article.
-
Genome-wide identification and expression analysis of glutathione S-transferase gene family in tomato: Gaining an insight to their physiological and stress-specific roles.PLoS One. 2017 Nov 2;12(11):e0187504. doi: 10.1371/journal.pone.0187504. eCollection 2017. PLoS One. 2017. PMID: 29095889 Free PMC article.
-
Genome-wide comparative analysis of RNA-binding Glycine-rich protein family genes between Gossypium arboreum and Gossypium raimondii.PLoS One. 2019 Jun 26;14(6):e0218938. doi: 10.1371/journal.pone.0218938. eCollection 2019. PLoS One. 2019. PMID: 31242257 Free PMC article.
References
-
- Bjellqvist B., Basse B., Olsen E., Celis J. E. (1994). Reference points for comparisons of two-dimensional maps of proteins from different human cell types defined in a pH scale where isoelectric points correlate with polypeptide compositions. Electrophoresis 15, 529–539. 10.1002/elps.1150150171 - DOI - PubMed
LinkOut - more resources
Full Text Sources
Other Literature Sources
Research Materials