. 2016 Feb 9:6:19.
doi: 10.3389/fcimb.2016.00019. eCollection 2016.

Brucella suis Vaccine Strain 2 Induces Endoplasmic Reticulum Stress that Affects Intracellular Replication in Goat Trophoblast Cells In vitro

Affiliations

Brucella suis Vaccine Strain 2 Induces Endoplasmic Reticulum Stress that Affects Intracellular Replication in Goat Trophoblast Cells In vitro

Xiangguo Wang et al. Front Cell Infect Microbiol. .

Abstract

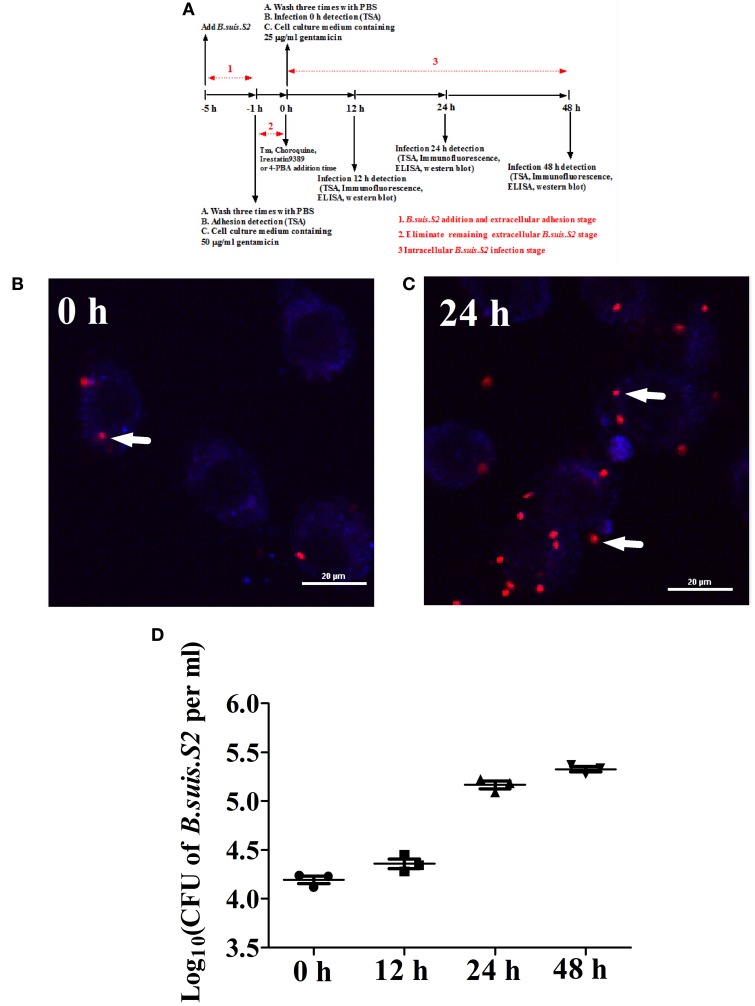
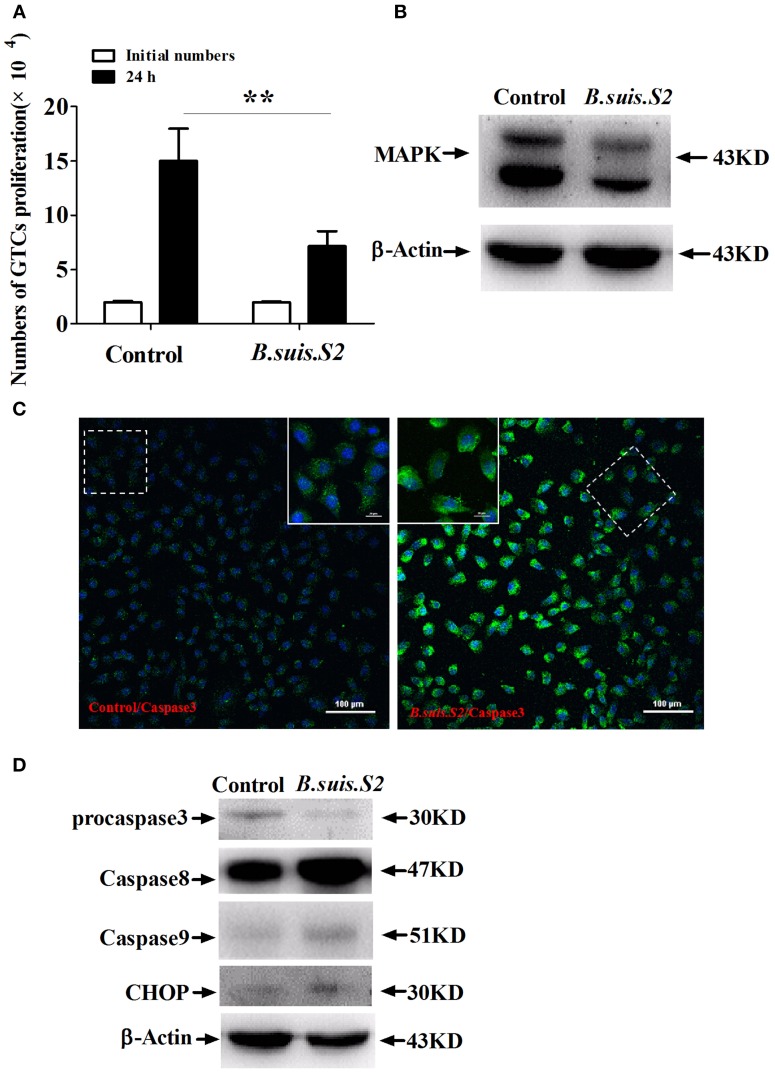
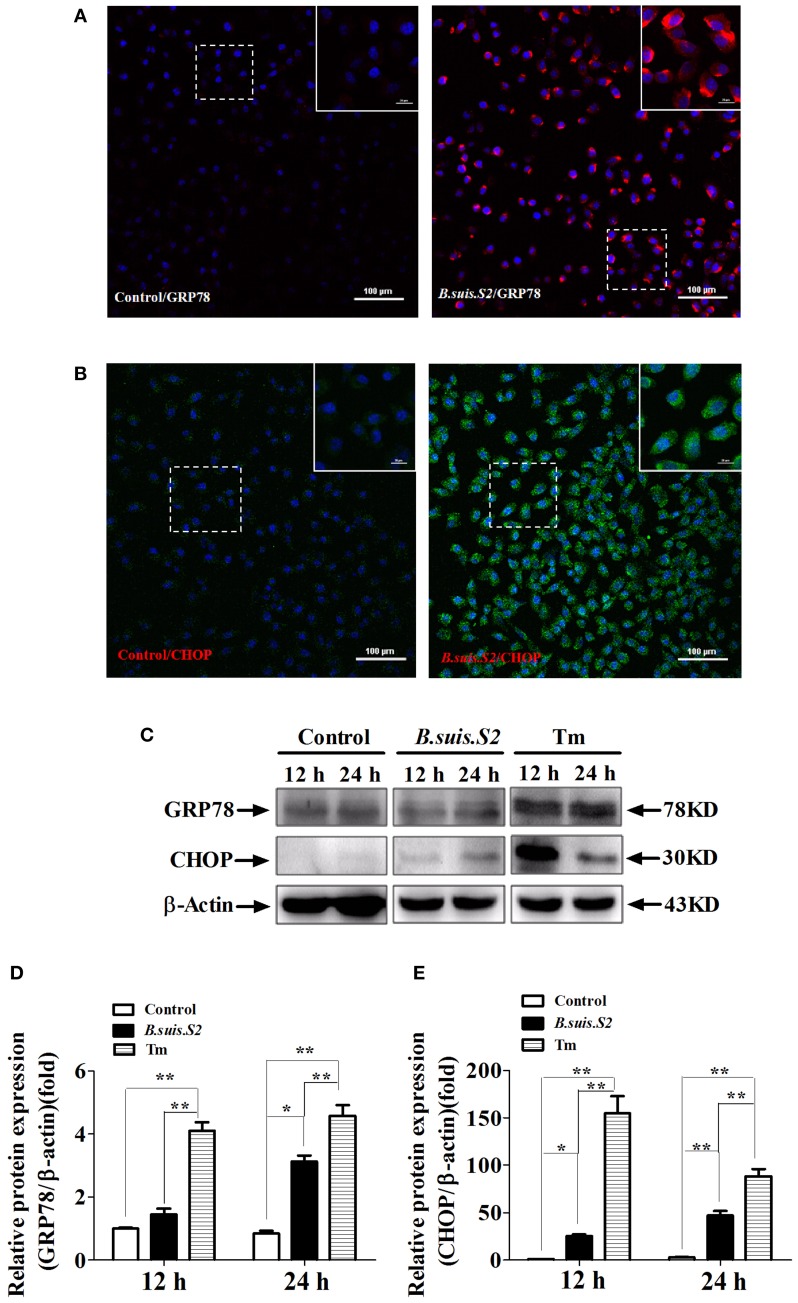
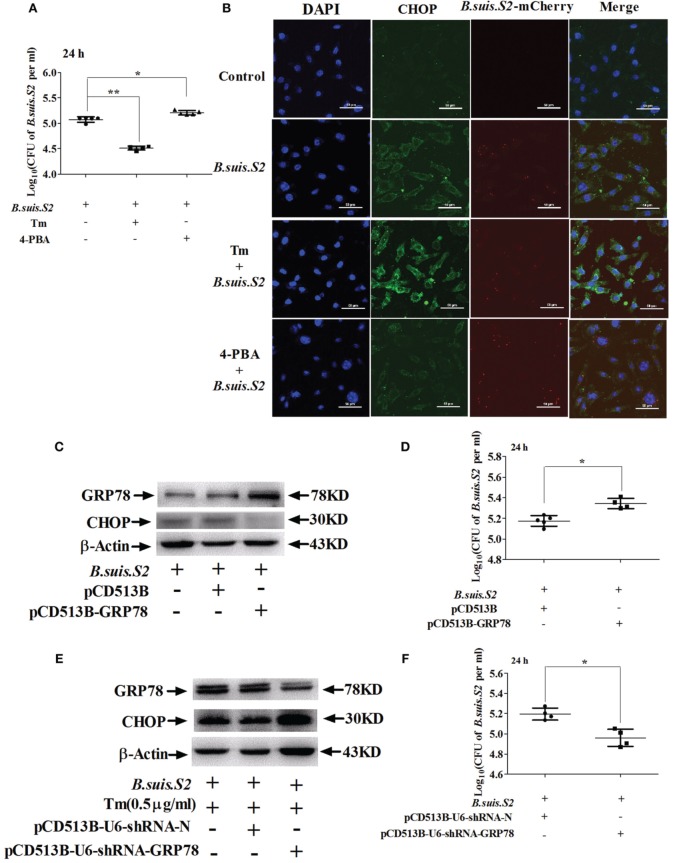
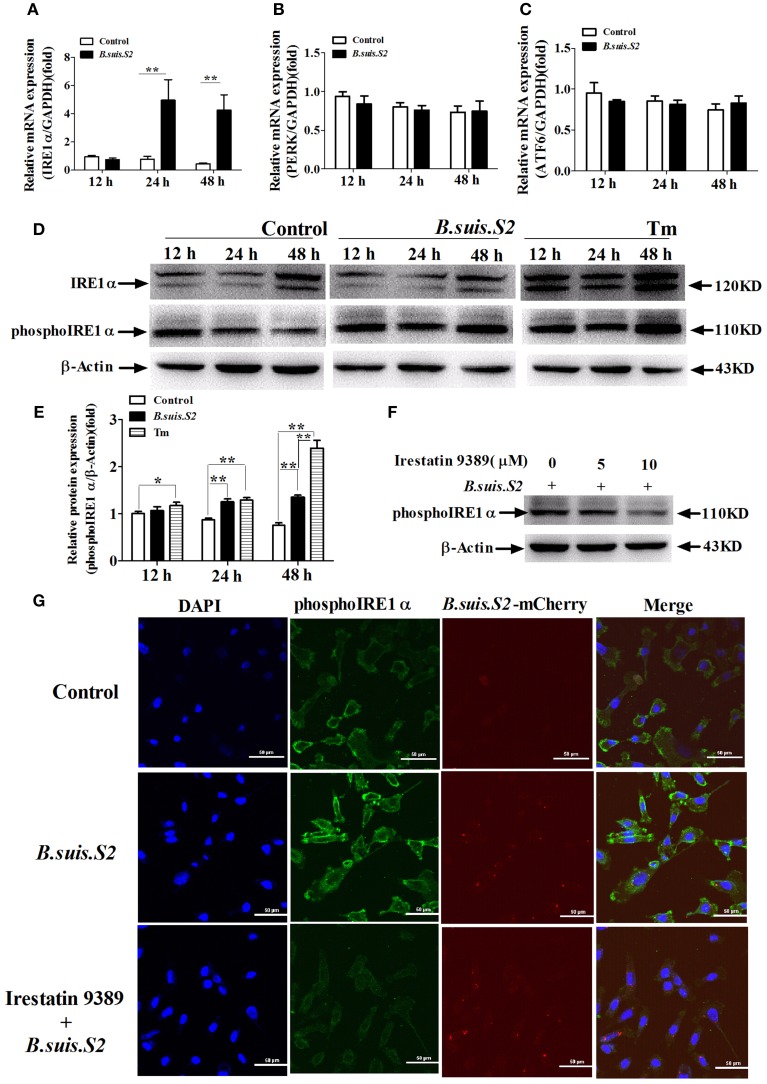
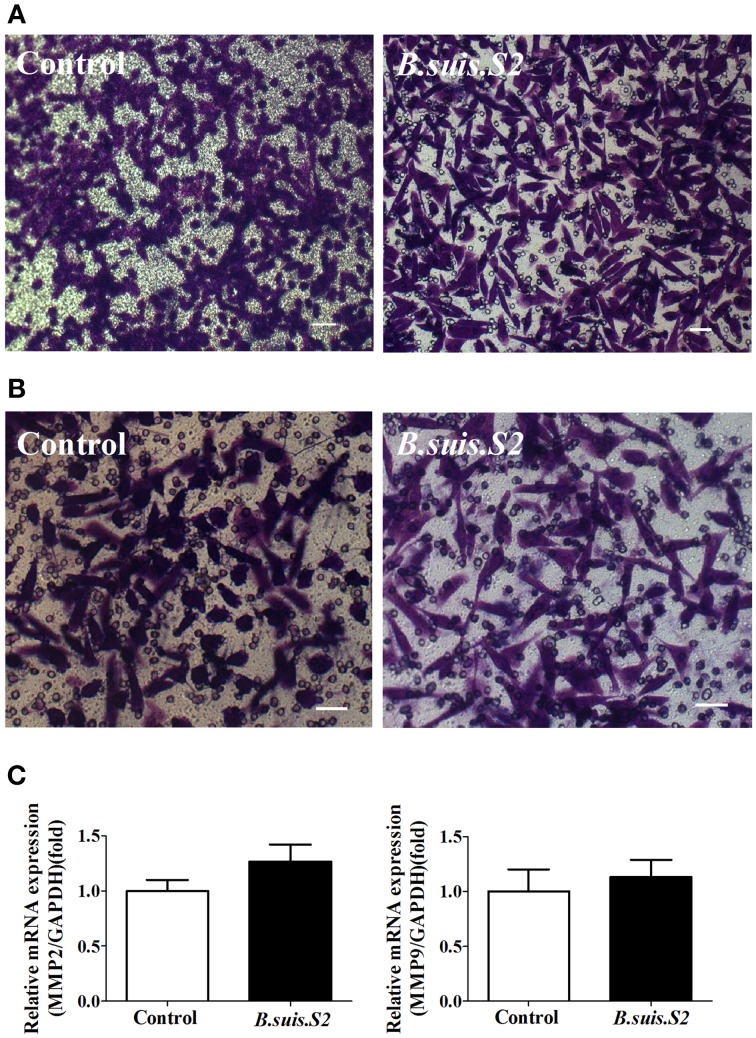
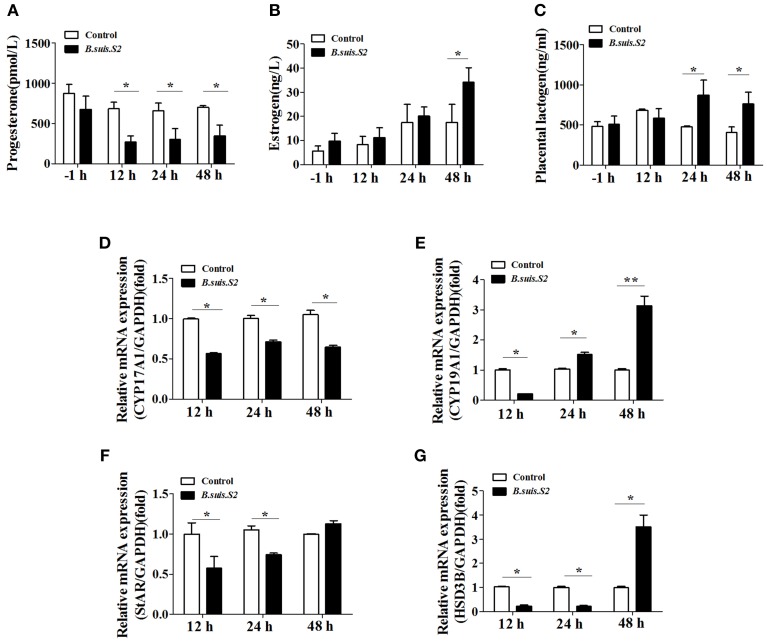
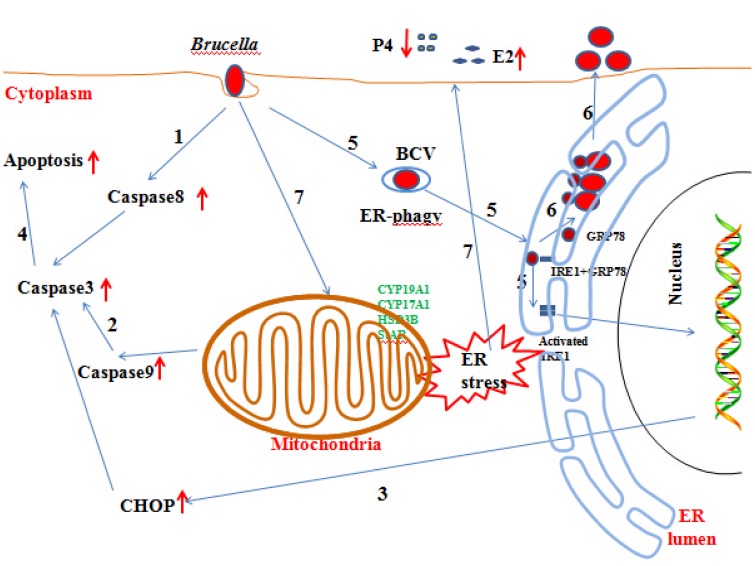
Brucella has been reported to impair placental trophoblasts, a cellular target where Brucella efficiently replicates in association with the endoplasmic reticulum (ER), and ultimately trigger abortion in pregnant animals. However, the precise effects of Brucella on trophoblast cells remain unclear. Here, we describe the infection and replication of Brucella suis vaccine strain 2 (B.suis.S2) in goat trophoblast cells (GTCs) and the cellular and molecular responses induced in vitro. Our studies demonstrated that B.suis.S2 was able to infect and proliferate to high titers, hamper the proliferation of GTCs and induce apoptosis due to ER stress. Tunicamycin (Tm), a pharmacological chaperone that strongly mounts ER stress-induced apoptosis, inhibited B.suis.S2 replication in GTCs. In addition, 4 phenyl butyric acid (4-PBA), a pharmacological chaperone that alleviates ER stress-induced apoptosis, significantly enhanced B.suis.S2 replication in GTCs. The Unfolded Protein Response (UPR) chaperone molecule GRP78 also promoted B.suis.S2 proliferation in GTCs by inhibiting ER stress-induced apoptosis. We also discovered that the IRE1 pathway, but not the PERK or ATF6 pathway, was activated in the process. However, decreasing the expression of phosphoIRE1α and IRE1α proteins with Irestatin 9389 (IRE1 antagonist) in GTCs did not affect the proliferation of B.suis.S2. Although GTC implantation was not affected upon B.suis.S2 infection, progesterone secretion was suppressed, and prolactin and estrogen secretion increased; these effects were accompanied by changes in the expression of genes encoding key steroidogenic enzymes. This study systematically explored the mechanisms of abortion in Brucella infection from the viewpoint of pathogen invasion, ER stress and reproductive endocrinology. Our findings may provide new insight for understanding the mechanisms involved in goat abortions caused by Brucella infection.

Keywords: B.suis.S2; apoptosis; endoplasmic reticulum stress; goat trophoblast cells; infection.


Figures

Figure 1
Figure 1
Infection and proliferation of B.suis.S2 in GTCs. (A) Schematic of B.suis.S2 infection. From −5 to −1 h is the B.suis.S2 addition and extracellular adhesion stage; −1 to 0 h is the stage in which extracellular B.suis.S2 is eliminated by adding 50 μg/ml gentamicin to the cell culture medium; 0–48 h is the intracellular B.suis.S2 infection stage; 0 h is the time of Tm (ER stress activator), 4-PBA (ER stress antagonist), Irestatin 9389 (IRE1αantagonist), or chloroquine (autophagy antagonist) addition. “−” represents pretreatment before the time point (0 h). (B,C) B.suis.S2-mCherry (MOI = 100:1)-infected GTCs at 0 h (B) and 24 h (C) (bar = 20 μm). The white arrows indicate B.suis.S2-mCherry in the GTCs. The images in B and C are representative of 3–4 independent experiments. (D) Intracellular multiplication of B.suis.S2 (MOI = 100:1). CFU numbers were determined after the lysis of infected cells at the indicated times post-infection by TSA plate counting. CFU numbers are shown on a log10 scale. All data represent the means ± standard deviations from 3 independent experiments.
Figure 2
Figure 2
Cell proliferation and apoptosis of B.suis.S2-infected GTCs. (A) The proliferation numbers of GTCs infected by B.suis.S2 (MOI = 100:1) were determined by cell counting. All data represent the means ± standard deviations from 4 independent experiments. **P < 0.01 vs. non-infected cells. (B) GTCs were infected with 100 MOI of B.suis.S2 for 24 h, lysed and subjected to Western blot analysis to detect MAPK8 protein expression. The image shown is representative of 3–4 independent experiments. (C) Confocal microscope images of total caspase-3 protein expression in B.suis.S2-infected GTCs at 24 h post-infection. The data shown are representative of 4 independent experiments. (D) GTCs were infected with 100 MOI of B.suis.S2 for 24 h, lysed and subjected to Western blot analysis to detect the expression of apoptosis-related genespro-caspase-3, caspase-8, caspase-9, and CHOP proteins. The data shown are representative of 4–5 independent experiments.
Figure 3
Figure 3
ER stress induced in B.suis.S2-infected GTCs. Confocal microscope images of GRP78 (A) and CHOP (B) protein expression in B.suis.S2-infected GTCs (MOI = 100:1) at 24 h. The data shown are representative of 4–5 independent experiments. (C) GTCs were infected with 100 MOI of B.suis.S2 for 12 and 24 h. The Tm-treated group was used as a positive control, lysed and subjected to Western blot analysis to detect GRP78 and CHOP protein expression. The data shown are representative of 5 independent experiments (D,E). Quantification of band intensities from 5 independent results was determined by densitometric analysis. Data represent the mean ± standard deviations from 5 independent experiments (*P < 0.05, **P < 0.01).
Figure 4
Figure 4
Manipulating ER stress in GTCs affects B.suis.S2 replication. (A) GTCs were infected with 100 MOI B.suis.S2 at −5 h. Then, 0.5 μg/mL Tm or 1 μM 4-PBA was added at 0 h. Cells were lysed after 24 h of B.suis.S2 infection. CFUs were determined by transfer to dilution plates. CFU numbers are shown on a log10 scale. Data represent the mean ± standard deviations from 5 independent experiments. *P < 0.05, **P < 0.01 vs. B.suis.S2-infected cells. (B) Confocal microscope images of CHOP protein expression in GTCs infected with B.suis.S2 only or plus 0.5 μg/mL Tm or 1 μM 4-PBA at 24 h. The data shown are a representative of 4–5 independent experiments. (C–F) The ER stress chaperone GRP78 promotes B.suis.S2 replication. (C) Over-expression of GRP78 in GTCs by pCD513B-GRP78 lentivirus transduction was detected with Western blot analysis. pCD513B was used as a control. Data shown are representative of 5 independent experiments. (D) Intracellular multiplication of B.suis.S2 CFU numbers (MOI = 100:1) was determined after the lysis of infected cells (GRP78 overexpression) at the indicated times post-infection using TSA plate counting. CFU numbers are shown on a log10 scale. Data represent the mean ± standard deviations from 4–5 independent experiments. *P < 0.05 versus the control. (E) Effective inhibition of GRP78 expression in 0.5 μg/ml Tm-treated GTCs by pCD513B-U6-shRNA-GRP78 lentivirus transduction was detected by Western blot analysis. pCD513B-U6-shRNA-N was used as a control. Data shown are representative of 5 independent experiments. (F) Intracellular multiplication of B.suis.S2 in CFUs (MOI = 100:1) was determined after the lysis of infected cells (GRP78 interference) at the indicated times post-infection using TSA plate counting. CFU numbers are shown on a log10 scale. Data represent the mean ± standard deviations from 4 independent experiments (*P < 0.05).
Figure 5
Figure 5
The UPR pathway is induced after B.suis.S2 infection. The mRNA expression levels of IRE1α (A), ATF6 (B), and PERK (C) are shown for the control and B.suis.S2-infected cells (MOI = 100:1) at 12, 24, and 48 h. Real-time PCR results from 5–6 separate experiments are shown (the data are corrected for expression of the housekeeping gene GAPDH, mean ± standard deviations), **P < 0.01 versus non-infected cells. (D) GTCs were infected with 100 MOI of B.suis.S2 for 12, 24, and 48 h, lysed and subjected to Western blot analysis to detect IRE1α and phosphoIRE1α expression. The data shown are representative of 4–5 independent experiments. (E) Quantification of phosphoIRE1α band intensities from three independent results was determined by densitometric analysis. Data represent the mean ± standard deviations from 4 independent experiments (*P < 0.05, **P < 0.01). (F) GTCs were infected with 100 MOI of B.suis.S2 alone or with Irestatin 9389 (5 or 10 μM) for 24 h, lysed and subjected to Western blot analysis to detect phosphoIRE1α protein expression. The data shown are representative of 5 independent experiments. (G) Confocal microscope images of phosphoIRE1α expression in B.suis.S2-infected GTCs with or without 10 μM Irestatin 9389 at 24 h. The data shown are representative of 4 independent experiments.
Figure 6
Figure 6
Effect of B.suis.S2 on the functions of GTCs. (A) The migration ability of B.suis.S2 (MOI = 100:1)-infected GTCs was measured using a Transwell chamber migration assay. Crystal violet was used to stain the migrated cells (bar = 10 μm). The data shown are representative of 4 independent experiments. (B) The invasion ability of B.suis.S2 (MOI = 100:1)-infected GTCs was measured using a Matrigel invasion chamber assay. Crystal violet was used to stain the invaded cells (bar = 20 μm). The data shown are representative of 4 independent experiments. (C) The mRNA expression levels of MMP2 and MMP9 are shown for the control at 24 h. The results of real-time PCR (the data are corrected for expression of the housekeeping gene GAPDH; mean ±standard deviations from 5–6 independent experiments, P < 0.05).
Figure 7
Figure 7
B.suis.S2 infection disturbed the endocrine balance of GTCs. GTC infection assays were performed as described in the Section Materials and Methods. Supernatants were collected at specific times (−1, 12, 24, and 48 h), and progesterone (A), estrogen (B), and prolactin (C) secretion was detected with ELISA kits according to the manufacturer's recommendations. Data represent the mean ± standard deviations from 5–6 independent experiments. *P < 0.05 vs. non-infected GTCs. (D–G) Effects of B.suis.S2 (MOI = 100:1) infection on the expression of genes encoding steroidogenic enzymes. Real-time PCR analysis revealed the expression of CYP17A1 (D), CYP19A1 (E), StAR (F), and HSD3B (G) in B.suis.S2-infected GTCs at 12, 24, and 48 h. The data are corrected for expression of the housekeeping gene GAPDH (mean ±standard deviations from 5–6 independent experiments, *P < 0.05, **P < 0.01 vs. the non-infected GTCs).
Figure 8
Figure 8
Updated model of the response of GTCs to B.suis.S2 infection. (1–5) Brucella completes adhesion to and invasion into host cells. Survival and replication inside host cells is critical for the establishment of chronic Brucella infection. Virulent smooth Brucella inhibits programmed macrophage cell death and replicates inside macrophages (Gross et al., ; Tolomeo et al., ; He et al., 2006). Rough Brucella strains induce macrophage cell death (Chen and He, 2009). In our study, apoptosis and the apoptotic proteins caspase −8, −9, −3, and CHOP were induced in B.suis.S2-infected GTCs. (6) To date, scientists have elucidated the stealthy intracellular lifestyle of Brucella spp. in host cells, as described in the Section Introduction. IRE1a, an endoplasmic reticulum (ER) resident protein that plays a key role in regulating Brucella infection (Qin et al., 2008), is activated in Brucella infections. Under homeostatic conditions, BiP/GRP78 sequesters ER membrane proteins that function in UPR. B.suis.S2 infection also induces ER stress in GTCs. Manipulating ER stress or GRP78 expression affects the proliferation of B.suis.S2 in GTCs. However, manipulating IRE1α expression in GTCs does not affect the bacterial numbers of B.suis.S2 at 24 h. (7) Brucella infection causes abortion and sterility in animals and debilitating disorders in humans. In our study, B.suis.S2 disturbed the balance of P4 and E2 secretion under ER stress by mediating the expression of hormone-synthesis enzymes.

Similar articles

Cited by

References

    1. Anderson T. D., Cheville N. F. (1986). Ultrastructural morphometric analysis of Brucella abortus-infected trophoblasts in experimental placentitis. Am. J. Pathol. 124, 226–237. - PMC - PubMed
    1. Barquero-Calvo E., Mora-Cartín R., Arce-Gorvel V., de Diego J. L., Chacón-Díaz C., Chaves-Olarte E., et al. . (2015). Brucella abortus induces the premature death of human neutrophils through the action of its lipopolysaccharide. PLoS Pathog. 11:e1004853. 10.1371/journal.ppat.1004853 - DOI - PMC - PubMed
    1. Celli J., de Chastellier C., Franchini D. M., Pizarro-Cerda J., Moreno E., Gorvel J. P. (2003). Brucella evades macrophage killing via VirB-dependent sustained interactions with the endoplasmic reticulum. J. Exp. Med. 198, 545–556. 10.1084/jem.20030088 - DOI - PMC - PubMed
    1. Celli J., Salcedo S. P., Gorvel J. P. (2005). Brucella coopts the small GTPase Sar1 for intracellular replication. Proc. Natl. Acad. Sci. U.S.A. 102, 1673–1678. 10.1073/pnas.0406873102 - DOI - PMC - PubMed
    1. Chen F., He Y. (2009). Caspase-2 mediated apoptotic and necrotic murine macrophage cell death induced by rough Brucella abortus. PLoS ONE 4:e6830. 10.1371/journal.pone.0006830 - DOI - PMC - PubMed

Publication types

MeSH terms