Systems Perturbation Analysis of a Large-Scale Signal Transduction Model Reveals Potentially Influential Candidates for Cancer Therapeutics
- PMID: 26904540
- PMCID: PMC4750464
- DOI: 10.3389/fbioe.2016.00010
Systems Perturbation Analysis of a Large-Scale Signal Transduction Model Reveals Potentially Influential Candidates for Cancer Therapeutics
Abstract
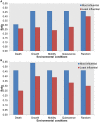
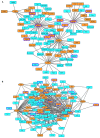
Dysregulation in signal transduction pathways can lead to a variety of complex disorders, including cancer. Computational approaches such as network analysis are important tools to understand system dynamics as well as to identify critical components that could be further explored as therapeutic targets. Here, we performed perturbation analysis of a large-scale signal transduction model in extracellular environments that stimulate cell death, growth, motility, and quiescence. Each of the model's components was perturbed under both loss-of-function and gain-of-function mutations. Using 1,300 simulations under both types of perturbations across various extracellular conditions, we identified the most and least influential components based on the magnitude of their influence on the rest of the system. Based on the premise that the most influential components might serve as better drug targets, we characterized them for biological functions, housekeeping genes, essential genes, and druggable proteins. The most influential components under all environmental conditions were enriched with several biological processes. The inositol pathway was found as most influential under inactivating perturbations, whereas the kinase and small lung cancer pathways were identified as the most influential under activating perturbations. The most influential components were enriched with essential genes and druggable proteins. Moreover, known cancer drug targets were also classified in influential components based on the affected components in the network. Additionally, the systemic perturbation analysis of the model revealed a network motif of most influential components which affect each other. Furthermore, our analysis predicted novel combinations of cancer drug targets with various effects on other most influential components. We found that the combinatorial perturbation consisting of PI3K inactivation and overactivation of IP3R1 can lead to increased activity levels of apoptosis-related components and tumor-suppressor genes, suggesting that this combinatorial perturbation may lead to a better target for decreasing cell proliferation and inducing apoptosis. Finally, our approach shows a potential to identify and prioritize therapeutic targets through systemic perturbation analysis of large-scale computational models of signal transduction. Although some components of the presented computational results have been validated against independent gene expression data sets, more laboratory experiments are warranted to more comprehensively validate the presented results.
Keywords: cancer; computational modeling; in silico perturbation analysis; signal transduction; therapeutic targets.
Figures


Similar articles
-
Identification of potential targets in biological signalling systems through network perturbation analysis.Biosystems. 2010 Apr;100(1):55-64. doi: 10.1016/j.biosystems.2010.01.002. Epub 2010 Jan 14. Biosystems. 2010. PMID: 20079399
-
Alternative splicing perturbation landscape identifies RNA binding proteins as potential therapeutic targets in cancer.Mol Ther Nucleic Acids. 2021 Apr 9;24:792-806. doi: 10.1016/j.omtn.2021.04.005. eCollection 2021 Jun 4. Mol Ther Nucleic Acids. 2021. PMID: 33996260 Free PMC article.
-
Detecting Functional Dynamics in Proteins with Comparative Perturbed-Ensembles Analysis.Acc Chem Res. 2019 Dec 17;52(12):3455-3464. doi: 10.1021/acs.accounts.9b00485. Epub 2019 Dec 3. Acc Chem Res. 2019. PMID: 31793290 Review.
-
Prioritizing drug targets by perturbing biological network response functions.PLoS Comput Biol. 2024 Jun 27;20(6):e1012195. doi: 10.1371/journal.pcbi.1012195. eCollection 2024 Jun. PLoS Comput Biol. 2024. PMID: 38935814 Free PMC article.
-
Cancer systems biology: a network modeling perspective.Carcinogenesis. 2010 Jan;31(1):2-8. doi: 10.1093/carcin/bgp261. Epub 2009 Oct 27. Carcinogenesis. 2010. PMID: 19861649 Free PMC article. Review.
Cited by
-
A multiscale mechanistic model of human dendritic cells for in-silico investigation of immune responses and novel therapeutics discovery.Front Immunol. 2023 Mar 10;14:1112985. doi: 10.3389/fimmu.2023.1112985. eCollection 2023. Front Immunol. 2023. PMID: 36993954 Free PMC article.
-
Identification of Biologically Essential Nodes via Determinative Power in Logical Models of Cellular Processes.Front Physiol. 2018 Aug 31;9:1185. doi: 10.3389/fphys.2018.01185. eCollection 2018. Front Physiol. 2018. PMID: 30233390 Free PMC article.
-
Identification of Cross-Pathway Connections via Protein-Protein Interactions Linked to Altered States of Metabolic Enzymes in Cervical Cancer.Front Med (Lausanne). 2021 Nov 1;8:736495. doi: 10.3389/fmed.2021.736495. eCollection 2021. Front Med (Lausanne). 2021. PMID: 34790674 Free PMC article.
-
Investigation on changes of modularity and robustness by edge-removal mutations in signaling networks.BMC Syst Biol. 2017 Dec 21;11(Suppl 7):125. doi: 10.1186/s12918-017-0505-2. BMC Syst Biol. 2017. PMID: 29322936 Free PMC article.
-
Connecting signaling and metabolic pathways in EGF receptor-mediated oncogenesis of glioblastoma.PLoS Comput Biol. 2019 Aug 6;15(8):e1007090. doi: 10.1371/journal.pcbi.1007090. eCollection 2019 Aug. PLoS Comput Biol. 2019. PMID: 31386654 Free PMC article.
References
-
- Bastian F., Parmentier G., Roux J., Moretti S., Laudet V., Robinson-Rechavi M. (2008). “Bgee: integrating and comparing heterogeneous transcriptome data among species,” in Data Integration in the Life Sciences, eds Bairoch A., Cohen-Boulakia S., Froidevaux C. (Berlin; Heidelberg: Springer; ), 124–131.
LinkOut - more resources
Full Text Sources
Other Literature Sources

