. 2016 Mar 8;6(3):342-56.
doi: 10.1016/j.stemcr.2016.01.013. Epub 2016 Feb 18.

ER Stress and Autophagic Perturbations Lead to Elevated Extracellular α-Synuclein in GBA-N370S Parkinson's iPSC-Derived Dopamine Neurons

Affiliations

ER Stress and Autophagic Perturbations Lead to Elevated Extracellular α-Synuclein in GBA-N370S Parkinson's iPSC-Derived Dopamine Neurons

Hugo J R Fernandes et al. Stem Cell Reports. .

Abstract

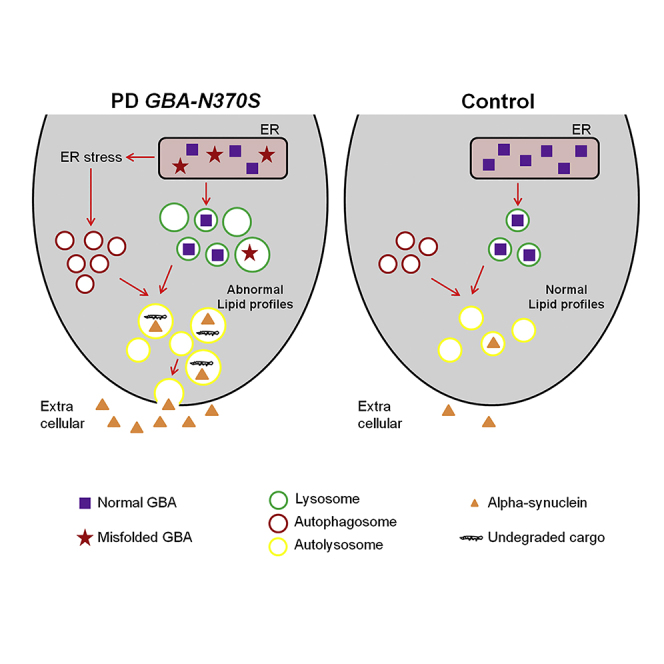
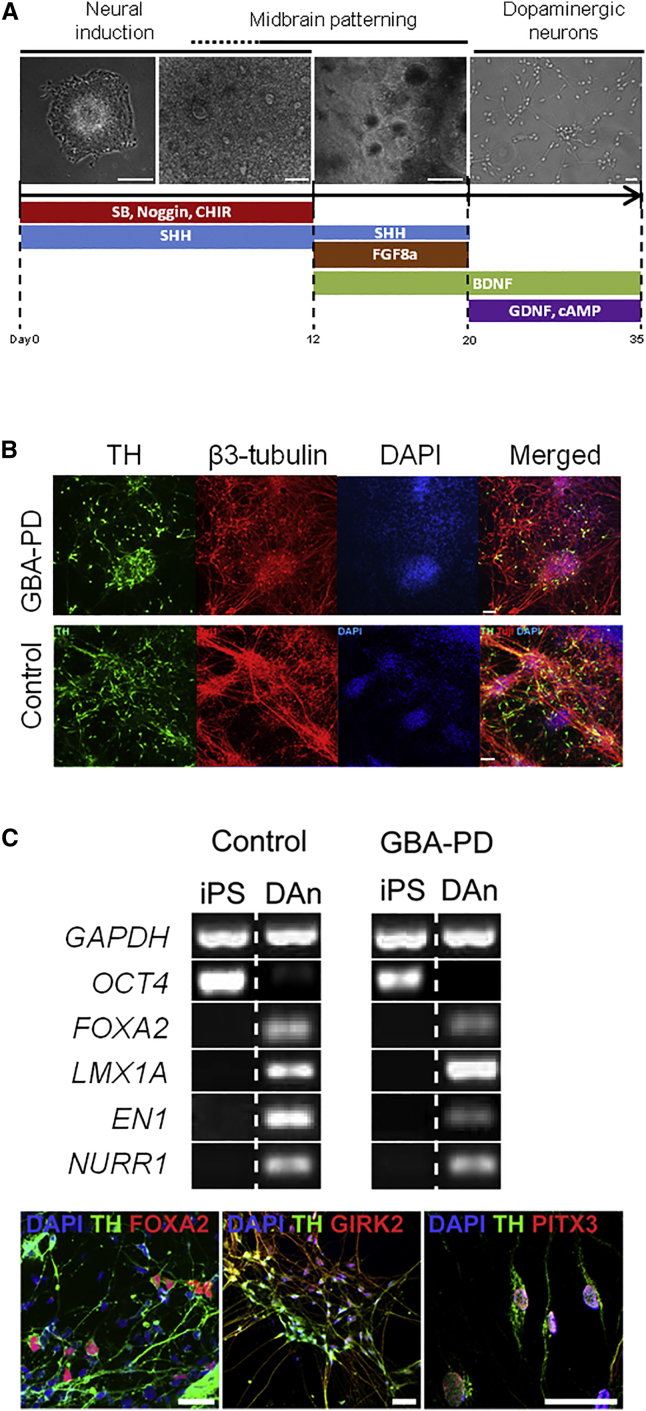
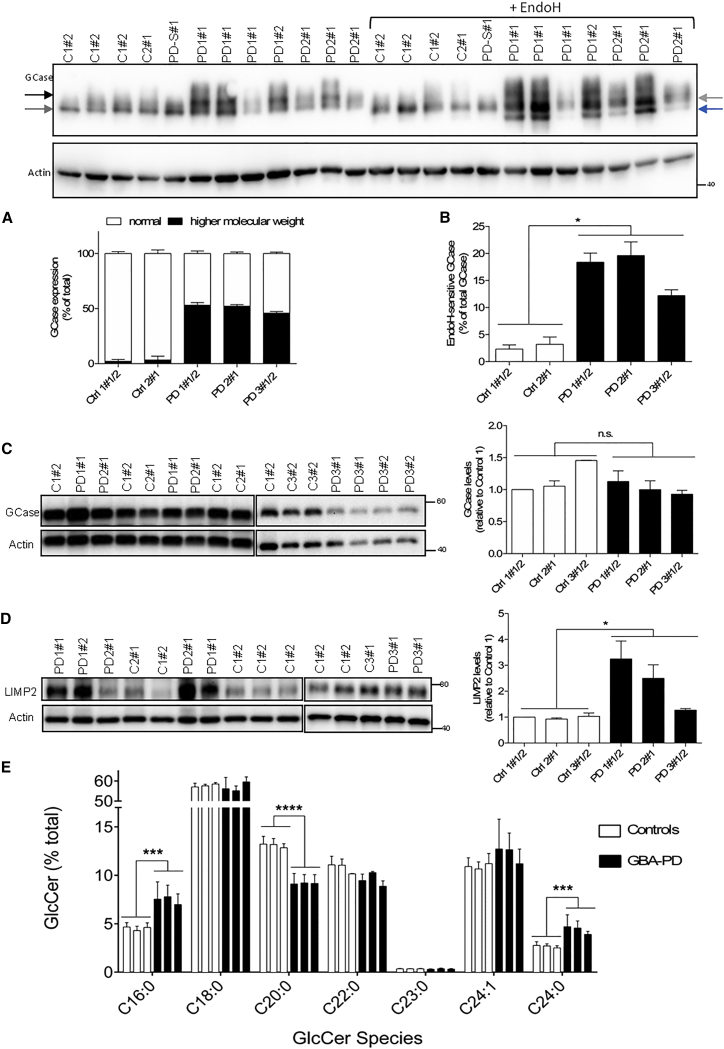
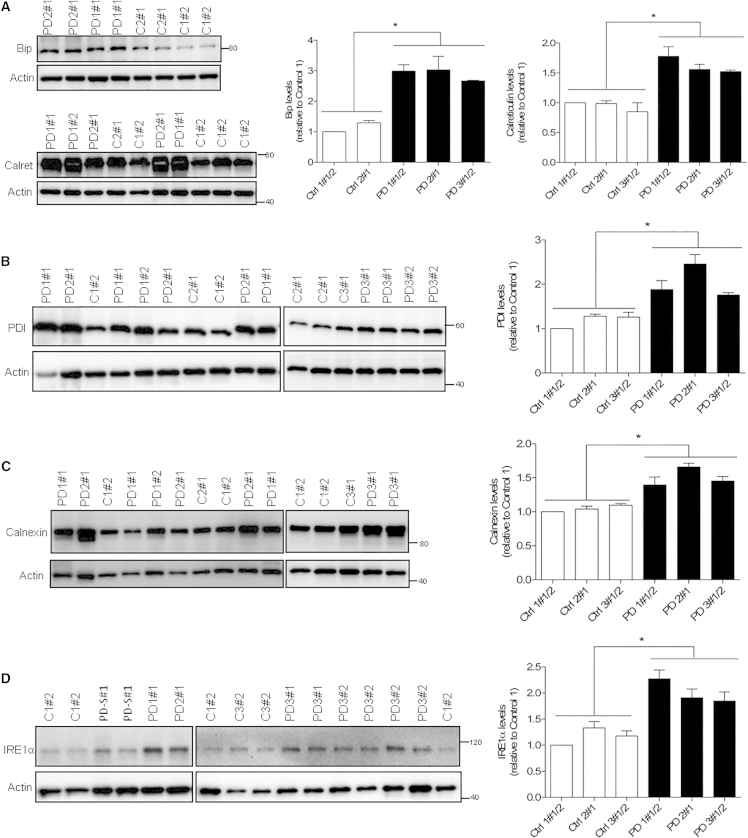
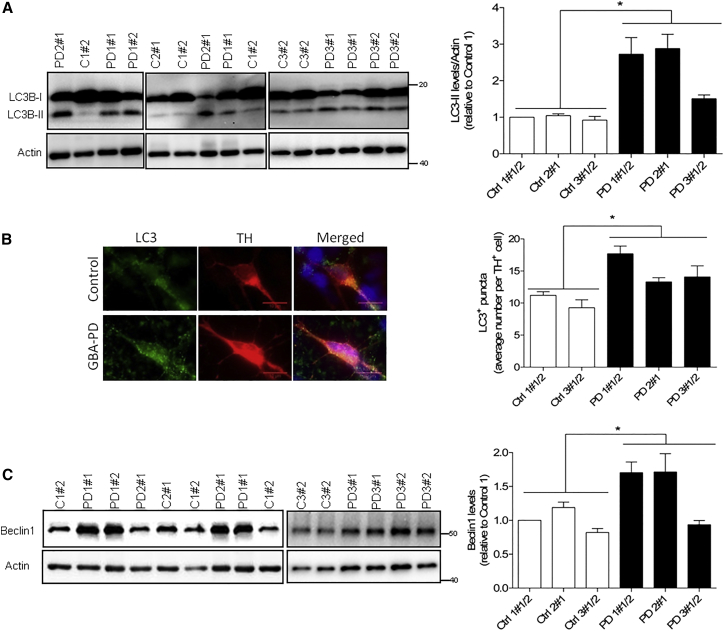
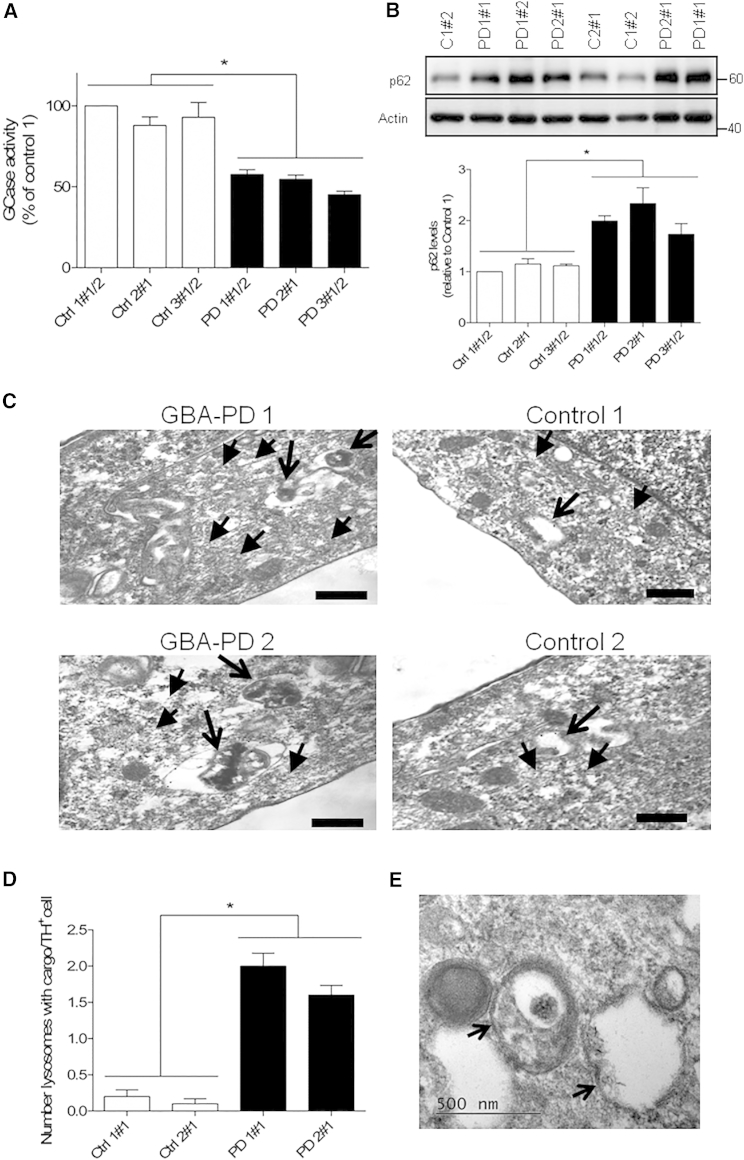
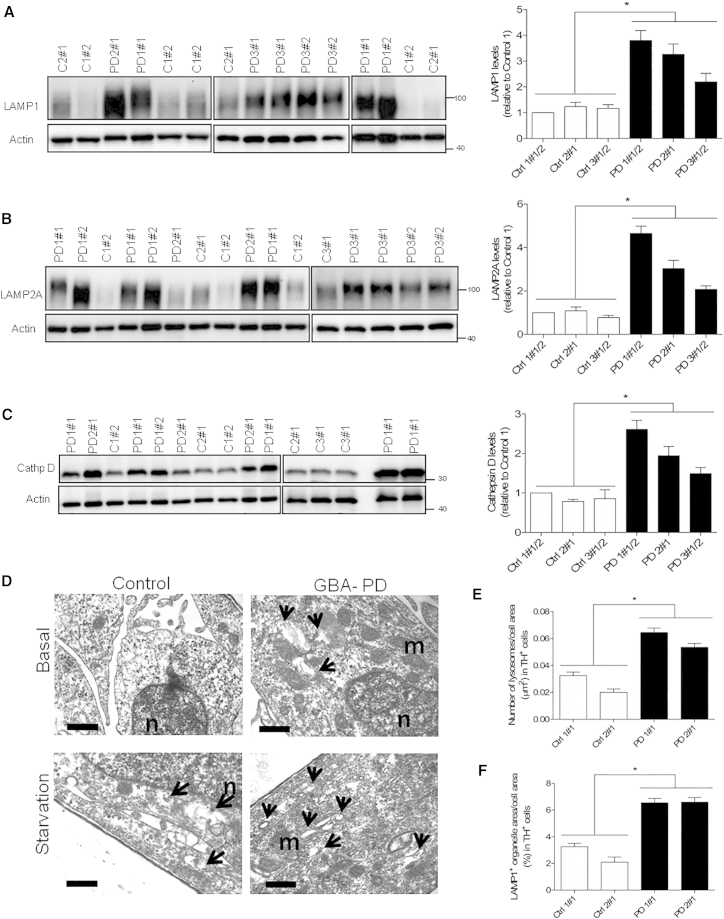
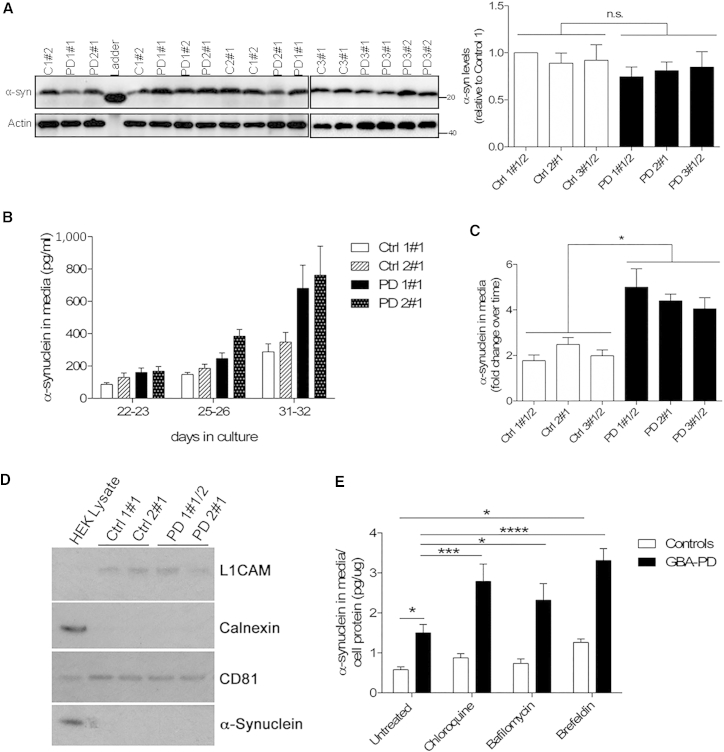
Heterozygous mutations in the glucocerebrosidase gene (GBA) represent the strongest common genetic risk factor for Parkinson's disease (PD), the second most common neurodegenerative disorder. However, the molecular mechanisms underlying this association are still poorly understood. Here, we have analyzed ten independent induced pluripotent stem cell (iPSC) lines from three controls and three unrelated PD patients heterozygous for the GBA-N370S mutation, and identified relevant disease mechanisms. After differentiation into dopaminergic neurons, we observed misprocessing of mutant glucocerebrosidase protein in the ER, associated with activation of ER stress and abnormal cellular lipid profiles. Furthermore, we observed autophagic perturbations and an enlargement of the lysosomal compartment specifically in dopamine neurons. Finally, we found increased extracellular α-synuclein in patient-derived neuronal culture medium, which was not associated with exosomes. Overall, ER stress, autophagic/lysosomal perturbations, and elevated extracellular α-synuclein likely represent critical early cellular phenotypes of PD, which might offer multiple therapeutic targets.


Figures

None
Graphical abstract
Figure 1
Figure 1
Generation and Characterization of iPSC-Derived Dopaminergic Neuronal Cultures (A) Schematic overview of conditions used for differentiation of iPSCs into dopaminergic neuronal cultures, with bright field representations of cells at several stages of differentiation (scale bar, 50 μm). (B) Immunohistochemistry representation of differentiated dopaminergic neuronal cultures at day 35 showing high expression levels for the neuronal marker β-3 tubulin (red), the dopaminergic neuron marker TH (green), and DAPI (blue). (C) RT-PCR analysis showed reduced expression of the pluripotency marker OCT4 and increased expression of floor plate markers (FOXA2 and LMX1A) and mature dopaminergic markers (EN1 and NURR1) in differentiated dopaminergic neuronal cultures (DAn) versus undifferentiated (iPS). Immunofluorescence analyses also confirmed the co-expression of TH with FOXA1, GIRK2, and PITX3 (scale bar, 50 μm). Results are representative of at least three independent differentiation experiments performed in triplicate per cell line. See also Figures S1–S3.
Figure 2
Figure 2
Aberrant GCase Post-translation Modification in Heterozygous GBA-N370S PD Dopaminergic Neuronal Cultures Representative western blot for differentiated dopaminergic neuronal cultures demonstrates the presence of two isoforms (gray and black arrows) for GCase protein specific for GBA-N370S cultures. (A) Quantification of GCase isoforms by western blot (as percentage of total GCase) confirms the higher molecular weight isoform (black bars) to be specific to GBA-N370S dopaminergic neuronal cultures, representing up to 50% of total GCase levels. (B) The GCase top isoform was sensitive to EndoH treatment shifting to a lower size band (blue arrow). Quantification of the EndoH-sensitive band represented as a percentage of total GCase for the respective line. Student's t test; p < 0.0001. PD-S#1 corresponds to a sporadic PD sample run but not analyzed further in this study. (C) No change of total GCase expression levels after PNGase F treatment. Representative western blot and quantification of GCase is shown. Student's t test; not significant. (D) Increased LIMP2 protein levels in heterozygous GBA-N370S PD dopaminergic cultures. Student's t test; p < 0.005. In each case, data represent the mean ± SEM from performing at least three independent differentiation experiments per line each analyzed in triplicate. (E) Analysis of different GlcCer species (C16:0, C18:0, C20:0, C22:0, C23:0, C24:0, C24:1, C24:0) as a percentage of total GlcCer shows a difference in the distribution of GlcCer species in GBA-N370S PD dopaminergic cultures compared with controls. Each bar represents the mean ± SEM of independent differentiated lines: three control and three GBA-N370S PD done in triplicate (n = 3). Student's t test; ∗∗∗p < 0.005; ∗∗∗∗p < 0.0001. See also Figure S4A.
Figure 3
Figure 3
ER Stress Upregulation in Heterozygous GBA-N370S Dopaminergic Neuronal Cultures (A) Representative western blot and quantification shows increased protein levels of the ER chaperones Bip and calreticulin. (B–D) Representative western blot and quantification of expression of further ER stress markers, namely PDI (B), calnexin (C), and IRE1α (D). In each case, data represent the mean ± SEM from performing at least three independent differentiation experiments per line each analyzed in triplicate. Student's t test; p < 0.0001. PD-S#1 corresponds to a sporadic PD sample run but not analyzed further in this study. See also Figure S4B.
Figure 4
Figure 4
Autophagic Disturbances in Heterozygous GBA-N370S PD Dopaminergic Neuronal Cultures (A) Representative western blot analysis and quantification showing increased LC3B-II protein levels. Student's t test; p < 0.0001. (B) Increased number of LC3+ puncta in TH+ cells. Immunofluorescence staining for LC3B (green) in dopaminergic TH-positive neurons (red) in control and PD patient dopaminergic neuronal cultures (scale bar, 20 μm). Student's t test; p < 0.0001. (C) Representative western blot and quantification of Beclin1 protein levels in differentiated dopaminergic cultures. Student's t test; p < 0.05. In each case, data represent the mean ± SEM from performing at least three independent differentiation experiments per line each analyzed in triplicate.
Figure 5
Figure 5
Impaired Lysosomal Degradation Capacity in Heterozygous GBA-N370S PD Dopamine Neurons (A) GCase enzyme activity in differentiated dopaminergic neuronal cultures was reduced to 50% when compared with controls. Student’s t test; p < 0.0001. (B) Increased p62 protein levels in heterozygous GBA-N370S dopaminergic cultures when compared with controls. Representative western blot analysis and respective quantification. In each case, data represent the mean ± SEM from performing at least three independent differentiation experiments per line each analyzed in triplicate. Student's t test; p < 0.0001. (C) Electron micrographs showing representative examples of undegraded cargo observed within lysosomal structures in TH immunogold-positive GBA-N370S-derived neurons. Arrows indicate LAMP1 positive structures of the lysosomal pathway; arrowheads indicate TH immunogold (5 nm). Scale bar, 200 nm. (D) Quantification shows increased number of lysosomes with undegraded cargo per TH+ cell in GBA-N370S cultures compared with controls. Data represent the mean ± SEM of n = 20 cells per line from two independent differentiation experiments. Student's t test; p < 0.001. (E) A high magnification image reveals double-membrane vesicles corresponding to autophagolysosomes, with arrows indicating double membranes.
Figure 6
Figure 6
Enlargement of the Lysosomal Compartment in Dopamine Neurons Derived from PD Patients Carrying a Heterozygous GBA-N370S Mutation (A–C) Increased protein levels of multiple lysosomal markers in heterozygous GBA-N370S PD dopaminergic cultures. Representative western blots and quantifications for the expression of: (A) LAMP1, (B) LAMP2A, and (C) cathepsin D. In each case, data represent the mean ± SEM from performing at least three independent differentiation experiments per line each analyzed in triplicate. Student's t test; p < 0.001. (D) Electron micrographs showing representative images of immunogold-labeled TH-positive neurons for differentiated controls and GBA-N370S neurons in basal and under starvation conditions. Arrows indicate LAMP1-positive structures of the lysosomal pathway. Scale bar, 200 nm. (E) Quantification of EM data shows an increase number of lysosomes in basal conditions for TH neurons in GBA-N370S cultures compared with controls. (F) The lysosomal compartment, represented as a percentage of the cell area occupied by LAMP1-labeled organelles, was also increased in size in TH-positive neurons in basal conditions in GBA-N370S cultures. In each case, data represent the mean ± SEM of n = 20 cells per line from two independent differentiation experiments. Student's t test; p < 0.001. See also Figure S5.
Figure 7
Figure 7
Increased Extracellular α-Synuclein in Heterozygous GBA-N370S-Derived Dopaminergic Neuronal Cultures (A) There is no difference in the intracellular α-synuclein content in dopaminergic neuronal cultures from controls and GBA-N370S PD lines. Representative western blot and quantification for intracellular α-synuclein levels. (B) Analysis of culture media by ELISA revealed the presence of α-synuclein, which increased over time. (C) Levels of extracellular α-synuclein in culture media were higher for heterozygous GBA-N370S dopaminergic cultures when compared with controls, during maturation, measured by ELISA. Fold change of neurons at day 31–36 compared with early neurons at day 21. In each case, data represent the mean ± SEM from performing at least three independent differentiation experiments per line each analyzed in triplicate. Student's t test; p < 0.001. (D) Western blot analysis of culture media extracted exosomes confirmed the expression of CD81 and L1CAM exosomal markers in the absence of calnexin. Data represent the mean of replicates ± SEM from performing at least three independent differentiation experiments per line. (E) Modulation of α-synuclein release in differentiated dopaminergic neurons from control and GBA-N370S dopaminergic cultures by treatment with CQ, bafilomycin A1, and brefeldin A, measured by the MesoScale Discovery platform. Each bar represents the mean ± SEM of differentiated lines from at least three independent individuals done in duplicate (n = 6–8). Two-way ANOVA; p < 0.05; ∗∗∗p < 0.005; ∗∗∗∗p < 0.0001. See also Figure S6.

References

    1. Alegre-Abarrategui J., Christian H., Lufino M.M., Mutihac R., Venda L.L., Ansorge O., Wade-Martins R. LRRK2 regulates autophagic activity and localizes to specific membrane microdomains in a novel human genomic reporter cellular model. Hum. Mol. Genet. 2009;18:4022–4034. - PMC - PubMed
    1. Alvarez-Erviti L., Seow Y., Schapira A.H., Gardiner C., Sargent I.L., Wood M.J., Cooper J.M. Lysosomal dysfunction increases exosome-mediated alpha-synuclein release and transmission. Neurobiol. Dis. 2011;42:360–367. - PMC - PubMed
    1. Basseri S., Austin R.C. Endoplasmic reticulum stress and lipid metabolism: mechanisms and therapeutic potential. Biochem. Res. Int. 2012;2012:841362. - PMC - PubMed
    1. Choi J.M., Kim W.C., Lyoo C.H., Kang S.Y., Lee P.H., Baik J.S., Koh S.B., Ma H.I., Sohn Y.H., Lee M.S. Association of mutations in the glucocerebrosidase gene with Parkinson disease in a Korean population. Neurosci. Lett. 2012;514:12–15. - PubMed
    1. Chutna O., Goncalves S., Villar-Pique A., Guerreiro P., Marijanovic Z., Mendes T., Ramalho J., Emmanouilidou E., Ventura S., Klucken J. The small GTPase Rab11 co-localizes with alpha-synuclein in intracellular inclusions and modulates its aggregation, secretion and toxicity. Hum. Mol. Genet. 2014;23:6732–6745. - PubMed

Publication types

MeSH terms