. 2016 Feb 23;11(2):e0149628.
doi: 10.1371/journal.pone.0149628. eCollection 2016.

Characterization of FGFR1 Locus in sqNSCLC Reveals a Broad and Heterogeneous Amplicon

Affiliations

Characterization of FGFR1 Locus in sqNSCLC Reveals a Broad and Heterogeneous Amplicon

Claire Rooney et al. PLoS One. .

Abstract

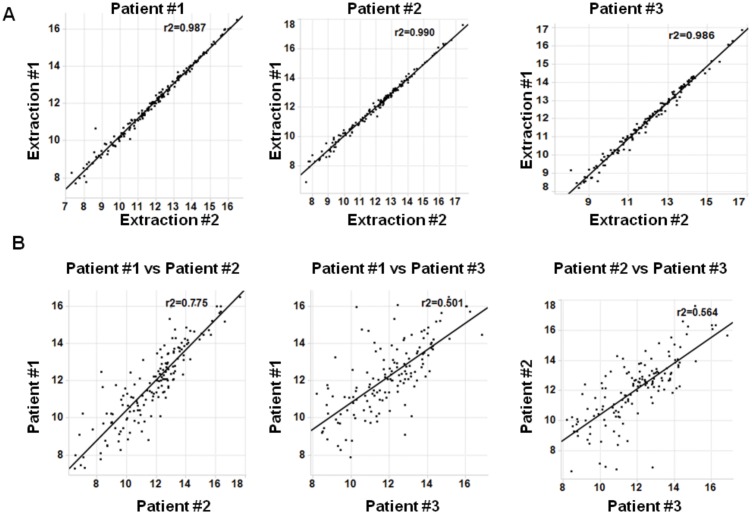
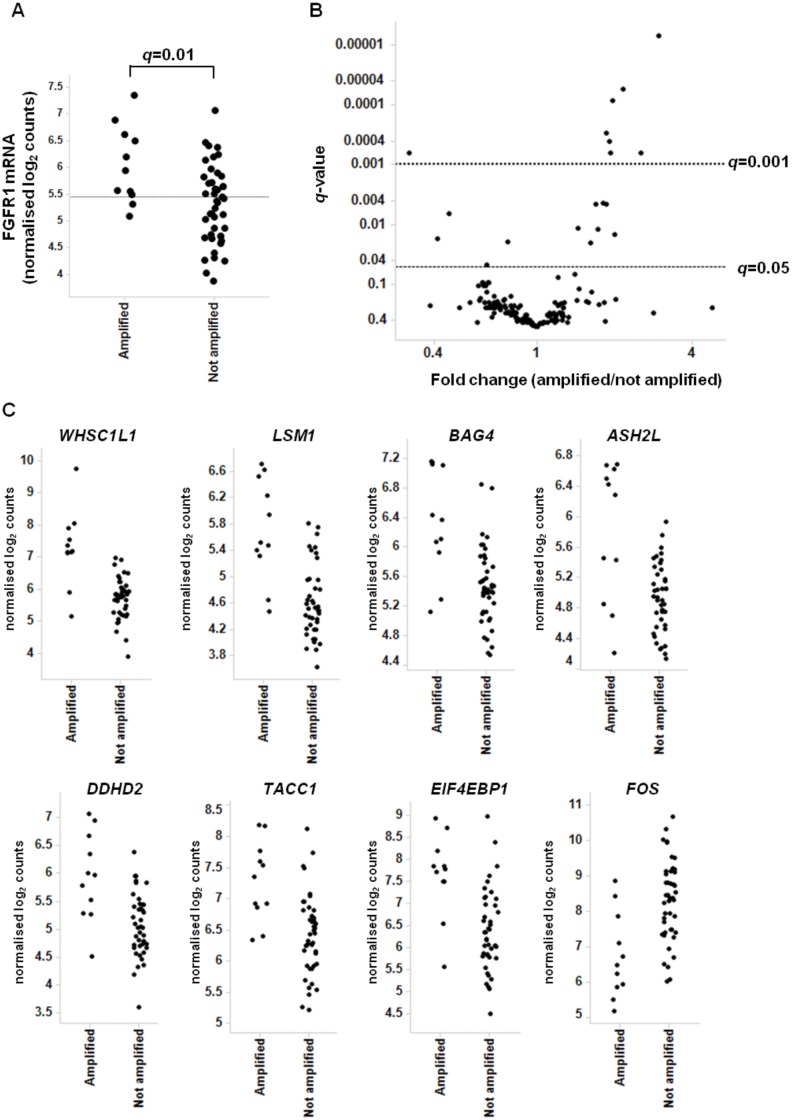
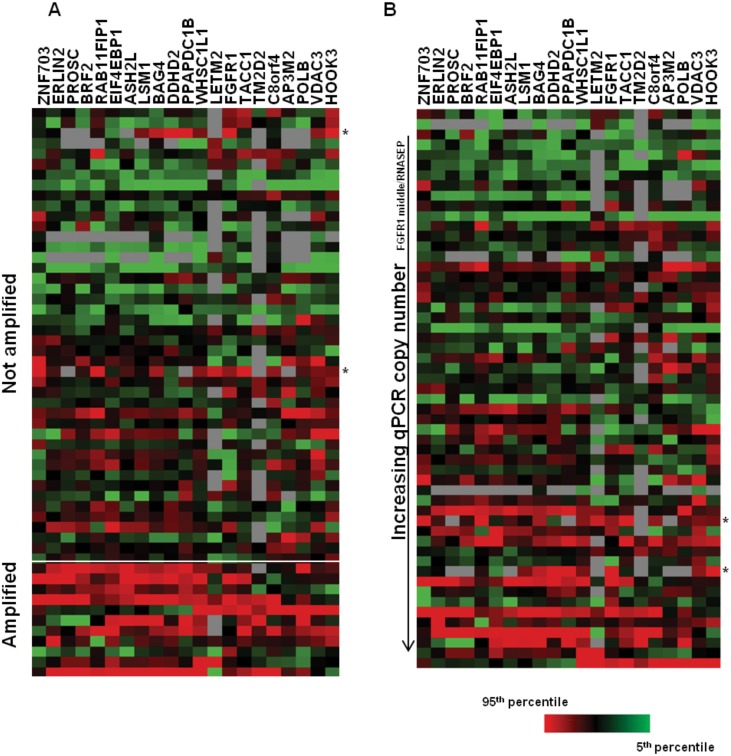
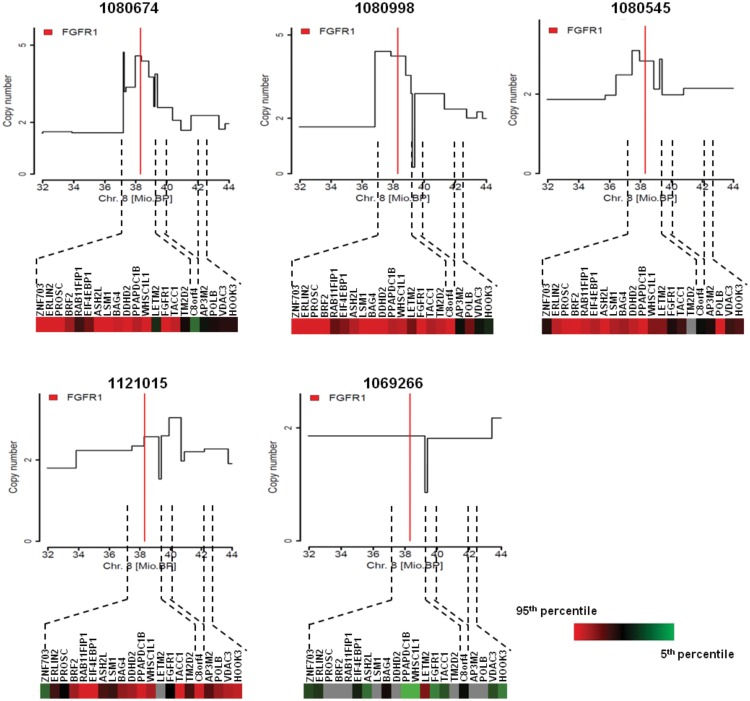
FGFR1 amplification occurs in ~20% of sqNSCLC and trials with FGFR inhibitors have selected FGFR1 amplified patients by FISH. Lung cancer cell lines were profiled for sensitivity to AZD4547, a potent, selective inhibitor of FGFRs 1-3. Sensitivity to FGFR inhibition was associated with but not wholly predicted by increased FGFR1 gene copy number. Additional biomarker assays evaluating expression of FGFRs and correlation between amplification and expression in clinical tissues are therefore warranted. We validated nanoString for mRNA expression analysis of 194 genes, including FGFRs, from clinical tumour tissue. In a panel of sqNSCLC tumours 14.4% (13/90) were FGFR1 amplified by FISH. Although mean FGFR1 expression was significantly higher in amplified samples, there was significant overlap in the range of expression levels between the amplified and non-amplified cohorts with several non-amplified samples expressing FGFR1 to levels equivalent to amplified samples. Statistical analysis revealed increased expression of FGFR1 neighboring genes on the 8p12 amplicon (BAG4, LSM1 and WHSC1L1) in FGFR1 amplified tumours, suggesting a broad rather than focal amplicon and raises the potential for codependencies. High resolution aCGH analysis of pre-clinical and clinical samples supported the presence of a broad and heterogeneous amplicon around the FGFR1 locus. In conclusion, the range of FGFR1 expression levels in both FGFR1 amplified and non-amplified NSCLC tissues, together with the breadth and intra-patient heterogeneity of the 8p amplicon highlights the need for gene expression analysis of clinical samples to inform the understanding of determinants of response to FGFR inhibitors. In this respect the nanoString platform provides an attractive option for RNA analysis of FFPE clinical samples.


Conflict of interest statement

Competing Interests: CR, CG, VW, KAK, MD, NRS, DB, TF, PDS, EAH, JCB, and EK are full time employees of AstraZeneca. JMH, RM and PS are employees of NEO New Oncology AG. This does not alter the authors' adherence to PLOS ONE policies on sharing data and materials.

Figures

Fig 1
Fig 1. Characterization of FGFR1 amplification, expression and sensitivity to AZD4547 in lung cancer cell lines.
A) FGFR1 copy number was determined in a lung cell line panel by qPCR. Three different assays targeting 5’, 3’ and middle regions of the gene are shown. Bars: stdev; Table reflects aCGH FGFR1 copy number for each cell line. B) Sensitivity to FGFR inhibition by AZD4547 treatment was determined by MTS proliferation assay. Sensitive cells lines were defined by GI50<200nM. C) Sensitivity to FGFR inhibition by AZD4547 was determined in a long term clonogenic assay in cell lines indicated. Mean colony count was normalised to DMSO control for each cell line. D) Expression of FGFR1 mRNA was determined in AZD4547 sensitive and resistant cell lines by nanoString analysis. E) Expression of FGFR1 protein was determined by western blot in indicated cell lines.
Fig 2
Fig 2. Assessment of inter- and intra-patient variability of nanoString gene expression profiles in sqNSCLC tissues.
A) Intra-tumoural variability was assessed using mRNA extracted from different regions of three sqNSCLC tissues. Extraction #1 and extraction #2 were from sections 190μm apart. B) Inter-patient variability between indicated samples was assessed. Input RNA: 400ng. Normalized log2 values of 194 genes are shown. Line of identity between samples is shown. r2 = Pearson correlation co-efficient.
Fig 3
Fig 3. Identification of genes with significant expression changes between FGFR1 amplified and non-amplified sqNSCLC tissues.
A) FGFR1 mRNA expression was assessed by nanoString in FGFR1 amplified and non-amplified tissues (as determined by FISH). Normalized log2 values are shown for each sample. Horizontal line indicates the mean FGFR1 expression of all samples. B) Volcano plot identifying genes with statistically significant expression changes between the amplified and non-amplified cohorts. C) nanoString gene expression data is shown for each gene with q-value <0.0001 between amplified and non-amplified cohorts in B. Normalized log2 values are shown.
Fig 4
Fig 4. Gene expression profiles of 8p amplicon genes in sqNSCLC tissues.
A) Heatmap reflecting nanoString gene expression profiles of FGFR1 amplified and non-amplified sqNSCLC tissues as determined by FISH. * indicates non-amplified samples which had gene expression profiles similar to those of the amplified samples. B) Heatmap reflecting nanoString gene expression profiles of sqNSCLC ranked by increasing FGFR1 inferred gene copy number as determined by qPCR. * indicates the same samples identified in A. red: 95th percentile, green: 5th percentile; grey: not detected.
Fig 5
Fig 5. In-depth high resolution array CGH of clinical samples confirms the presence of a broad amplicon at the FGFR1 locus.
In-depth high resolution genomic analysis of the FGFR1 locus using a custom CGH array was performed on indicated samples. The position of FGFR1 is indicated by a red line. Corresponding nanoString gene expression profiles for genes in the chromosomal region are shown. red: 95th percentile, green: 5th percentile; grey: not detected.
Fig 6
Fig 6. In-depth high resolution array CGH of cell lines identifies a broad amplicon at the FGFR1 locus.
In-depth high resolution genomic analysis of the FGFR1 locus using a custom CGH array was performed on indicated cell lines. The position of FGFR1 is indicated by a red line. Corresponding nanoString gene expression profiles for genes in the chromosomal region are shown. red: 95th percentile, green: 5th percentile; grey: not detected.

References

    1. DeSantis CE, Lin CC, Mariotto AB, Siegel RL, Stein KD, Kramer JL, et al. Cancer Treatment and Survivorship Statistics, 2014. Ca-Cancer J Clin. 2014;64(4):252–71. 10.3322/Caac.21235 WOS:000339475900004. - DOI - PubMed
    1. Mitsudomi T, Morita S, Yatabe Y, Negoro S, Okamoto I, Tsurutani J, et al. Gefitinib versus cisplatin plus docetaxel in patients with non-small-cell lung cancer harbouring mutations of the epidermal growth factor receptor (WJTOG3405): an open label, randomised phase 3 trial. The Lancet Oncology. 2010;11(2):121–8. 10.1016/S1470-2045(09)70364-X . - DOI - PubMed
    1. Maemondo M, Inoue A, Kobayashi K, Sugawara S, Oizumi S, Isobe H, et al. Gefitinib or chemotherapy for non-small-cell lung cancer with mutated EGFR. The New England journal of medicine. 2010;362(25):2380–8. 10.1056/NEJMoa0909530 . - DOI - PubMed
    1. Shaw AT, Yeap BY, Solomon BJ, Riely GJ, Gainor J, Engelman JA, et al. Effect of crizotinib on overall survival in patients with advanced non-small-cell lung cancer harbouring ALK gene rearrangement: a retrospective analysis. The Lancet Oncology. 2011;12(11):1004–12. 10.1016/S1470-2045(11)70232-7 - DOI - PMC - PubMed
    1. Brahmer J, Reckamp KL, Baas P, Crino L, Eberhardt WE, Poddubskaya E, et al. Nivolumab versus Docetaxel in Advanced Squamous-Cell Non-Small-Cell Lung Cancer. The New England journal of medicine. 2015. 10.1056/NEJMoa1504627 . - DOI - PMC - PubMed

MeSH terms