. 2016 Feb 23;9(416):ra21.
doi: 10.1126/scisignal.aac5472.

Trehalose inhibits solute carrier 2A (SLC2A) proteins to induce autophagy and prevent hepatic steatosis

Affiliations

Trehalose inhibits solute carrier 2A (SLC2A) proteins to induce autophagy and prevent hepatic steatosis

Brian J DeBosch et al. Sci Signal. .

Abstract

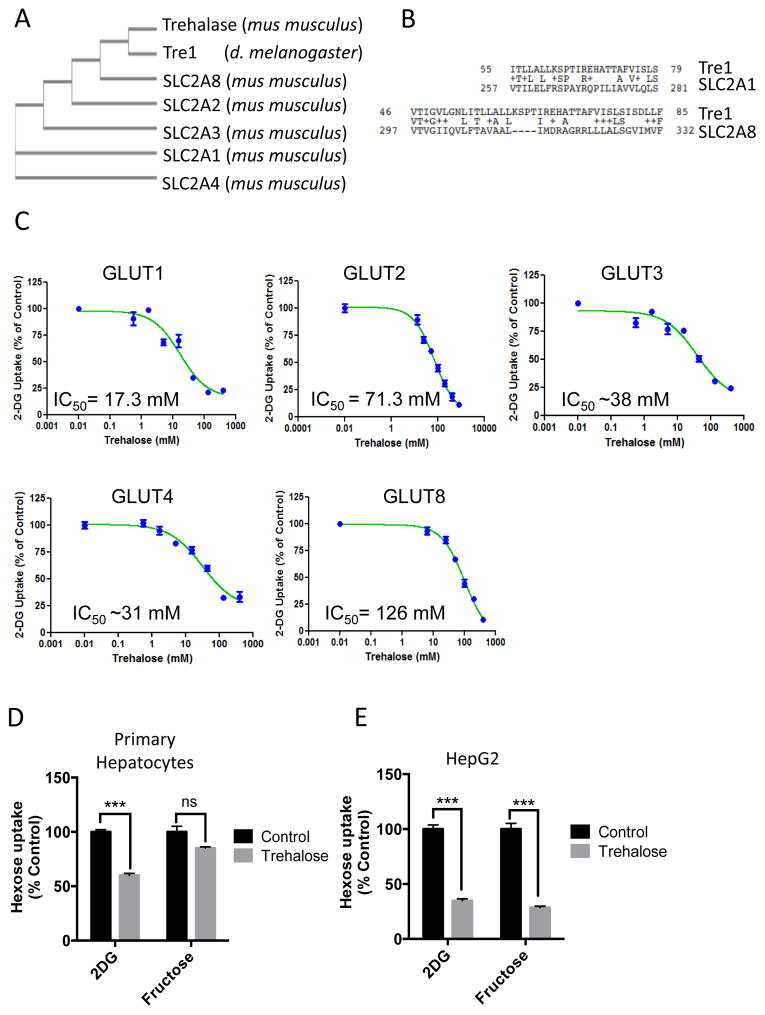
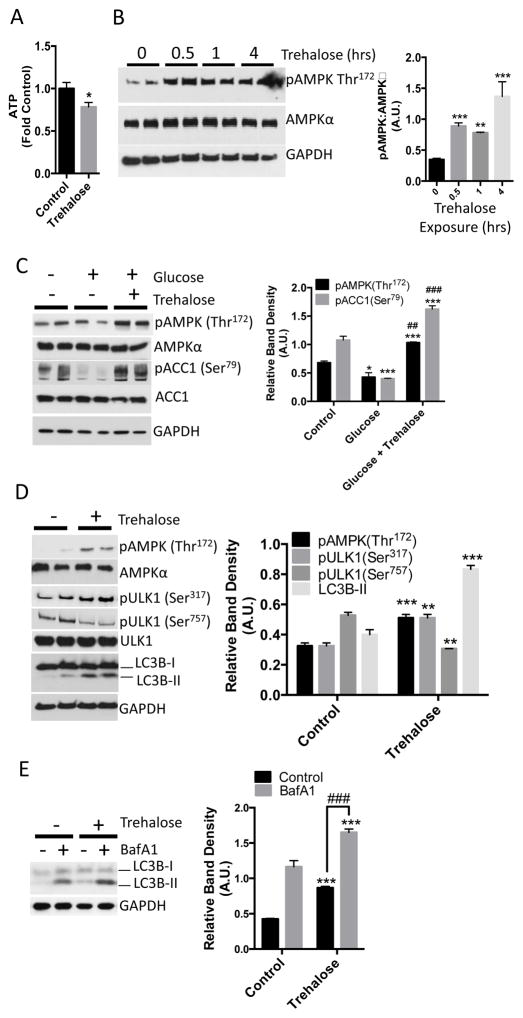
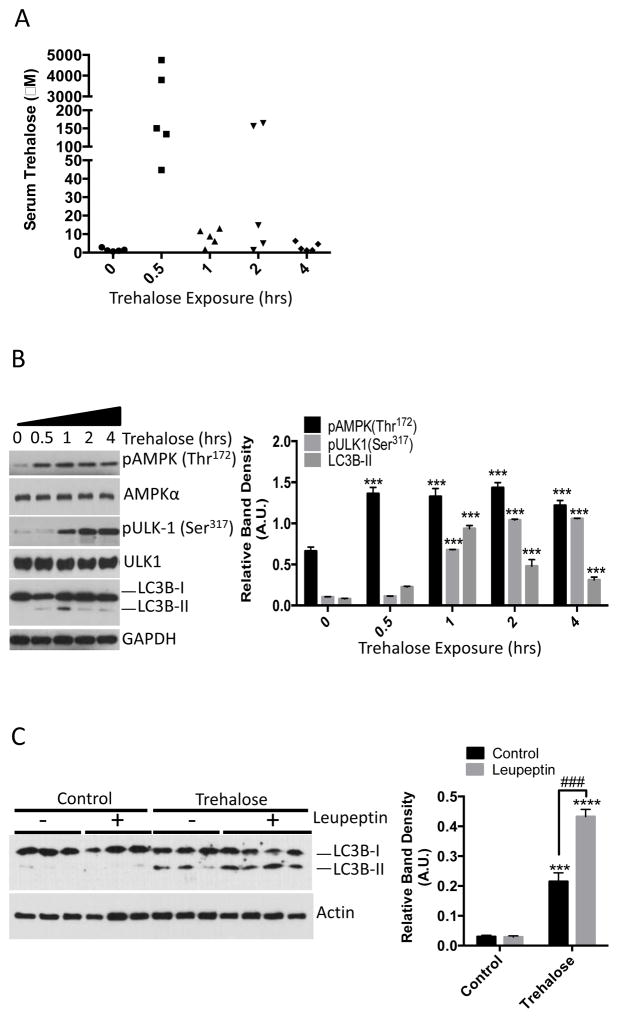
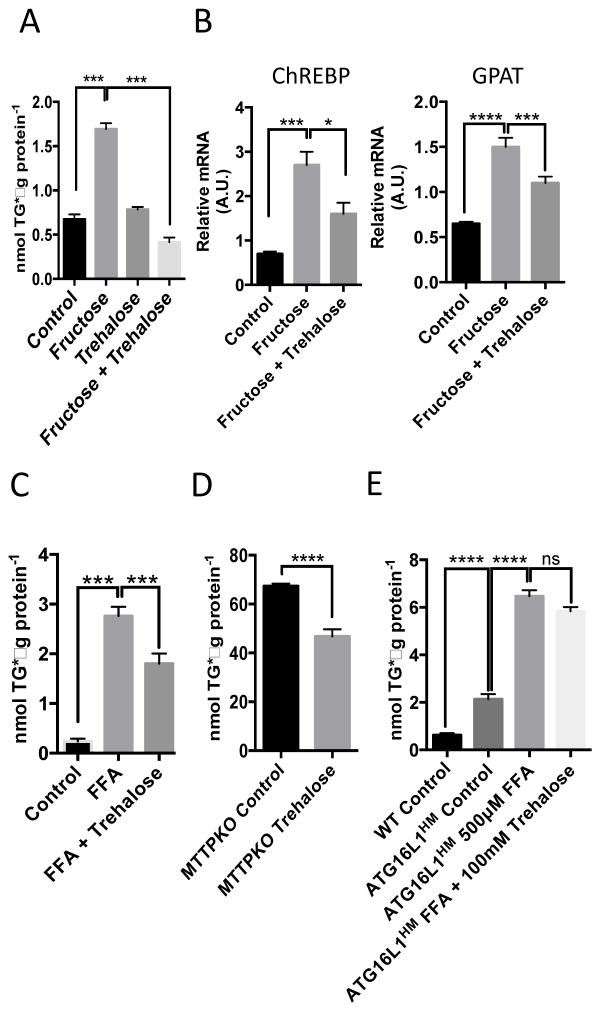
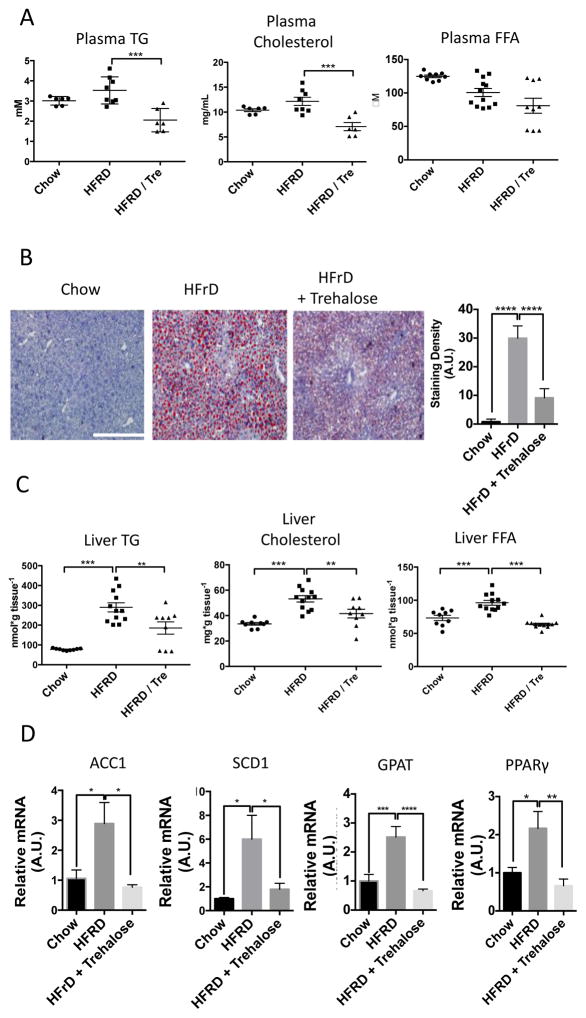
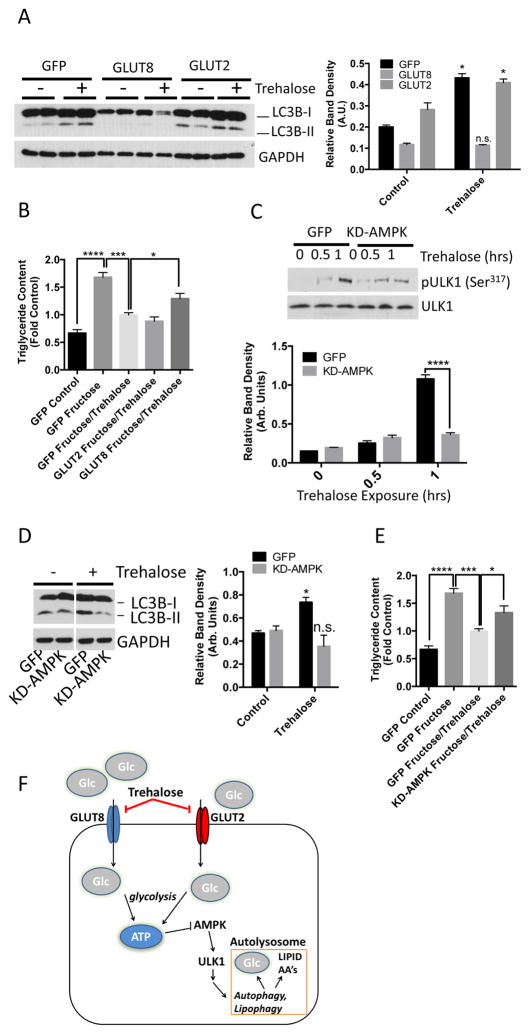
Trehalose is a naturally occurring disaccharide that has gained attention for its ability to induce cellular autophagy and mitigate diseases related to pathological protein aggregation. Despite decades of ubiquitous use as a nutraceutical, preservative, and humectant, its mechanism of action remains elusive. We showed that trehalose inhibited members of the SLC2A (also known as GLUT) family of glucose transporters. Trehalose-mediated inhibition of glucose transport induced AMPK (adenosine 5'-monophosphate-activated protein kinase)-dependent autophagy and regression of hepatic steatosis in vivo and a reduction in the accumulation of lipid droplets in primary murine hepatocyte cultures. Our data indicated that trehalose triggers beneficial cellular autophagy by inhibiting glucose transport.


Conflict of interest statement

Competing interests: KHM is on the Scientific Board of Advisors for OvaScience.

Figures

Figure 1
Figure 1
Trehalose inhibits glucose transport through SLC2A transporters. A. Common evolutionary ancestry for trehalase, Tre1, and SLC2A family members by ClustalW2 phylogeny analysis. B. Tre1 pairwise alignment with the substrate-selecting 7th-transmembrane domains in SLC2A1 and SLC2A8. C. 2-DG uptake in response to increasing trehalose concentrations in 293 cells expressing the indicated GLUT protein. Data are expressed as the mean % uptake relative to control cultures not treated with trehalose ± SEM from N = 3 independent experiments, n = 3 replicates per experiment. D. [3H]-2-DG and [14C]-Fructose uptake in primary hepatocytes. Data are expressed as the mean uptake relative to trehalose-untreated control groups ± SEM from N = 3 independent experiments, n = 3 replicates per experiment. E. [3H]-2-DG and [14C]-Fructose uptake in HepG2 cells.. Data are shown as mean uptake relative to trehalose-untreated control groups ± SEM from N = 3 independent experiments, n = 3 replicates per experiment., ***, P < 0.001 versus vehicle-treated by two-tailed T-Test. N.S., not significant versus vehicle-treated.
Figure 2
Figure 2
Trehalose decreases hepatocyte ATP and activates AMPK and autophagic flux. A. ATP quantification in hepatocytes treated with or without 100 mM trehalose for 30 minutes. Data are shown as mean fold of control (growth-media-treated) ATP ± SEM for, N= 3 independent experiments, n = 3 replicates per experiment. *, P < 0.05 by two-tailed T-Test. B. Left, immunoblot demonstrating AMPK (Thr172) phosphorylation in trehalose-treated hepatocytes (0–4hrs). Right, immunoblot quantification of pAMPK (Thr172) normalized to AMPKα band density. Data are shown as mean ± SEM for, N= 3 independent experiments, n = 2–3 replicates per experiment. **, P < 0.01 ***, P < 0.001 versus untreated control (“0 hour” data) (one-way ANOVA and Sidak’s post hoc analysis). C. Left, immunoblot depicting AMPK and ACC1 phosphorylation in HBSS-starved hepatocytes, followed by refeeding with unsupplemented HBSS (denoted as “−” group on blot and “control” on graph) or HBSS containing 25 mM glucose in the presence or absence of 100 mM trehalose for 30 minutes. Right, quantification of AMPK and ACC1 phosphorylation at Thr172 and Ser79 normalized to AMPKα and ACC1 band density, respectively. Data are shown as mean ± SEM for, N = 3 independent experiments, n = 2 replicates per experiment, In the glucose-treated group * and *** represent P < 0.05 and P < 0.001 versus controls (one-way ANOVA and Sidak’s post hoc analysis). In the glucose + trehalose-treated group, *** represents P < 0.001 versus cells treated with glucose alone (one-way ANOVA and Sidak’s post hoc analysis). ## and ###, P < 0.01 and P < 0.001 versus control group (one-way ANOVA and Sidak’s post hoc analysis) D. Left, immunoblot depicting ULK1 phosphorylation (Ser317 and Ser757) and LC3B-II accumulation after 1 hour incubation without (control) or with 100 mM trehalose. Right, quantification of AMPK and ULK1 phosphorylation, and LC3B-II band density normalized to AMPKα, ULK1, and GAPDH, respectively. Data are shown as mean ± SEM for, N = 3 independent experiments, n = 2 replicates per experiment, **, P < 0.01 versus control and ***, P < 0.001 versus control by 2-tailed T-Test. E. LC3B-I and LC3B–II immunoblotting in hepatocytes following treatment with or without 100 mM trehalose and 100 nM bafilomycin A1 for 1 hr. Control groups were treated with DMSO. Right, LC3B-II band density, normalized to GAPDH density. Data are shown as mean ± SEM for, N = 5 independent experiments, n = 1–3 replicates per experiment ***, P < 0.001 versus control groups. ###, P < 0.001 between bracketed groups by one-way ANOVA and Sidak’s post-hoc analysis for multiple comparisons.
Figure 3
Figure 3
Orally administered trehalose rapidly accumulates in peripheral circulation and induces hepatic autophagy. A. Liquid chromatography-mass spectrometric analysis of serum isolated from mice administered 3 g/kg trehalose by gavage and analyzed after 0.5, 1, 2, or 4 hours. Serum analyzed at the “0 hour” trehalose-treatment time point was derived from mice 30 minutes after gavage with 0.9% NaCl. N = 5 mice per treatment group. B. Left, immunoblot analysis of crude liver lysates from mice administered 3 g/kg trehalose and analyzed after 0.5, 1, 2 or 4 hrs. Liver lysates analyzed at the “0 hour” trehalose-treatment time point were derived from mice 30 minutes after gavage with 0.9% NaCl. Right, Quantification of pAMPK, pULK-1 and LC3B-II, normalized to AMPKα, ULK1, and GAPDH, respectively. Data are shown as mean ± SEM for, N = 5 independent mice per treatment group. ***, P < 0.001 versus 0-hour treatment group (one-way ANOVA and Sidak’s post hoc analysis) C. Left, immunoblot analysis of LC3B-II in liver lysates from mice treated with or without 40 mg/kg leupeptin 1 hr prior to oral gavage with 3 g/kg trehalose. Right, quantification of LC3B-II:Actin band density ratio. Data are shown as mean ± SEM for, N = 3–4 independent mice per treatment group, ***, P < 0.001 and ****, P < 0.0001 versus saline-treated controls (2-tail T-Test). ***, P < 0.001 between trehalose-treated groups treated with leupeptin versus leupeptin-untreated group (denoted by brackets) by 2-tail T-Test.
Figure 4
Figure 4
Trehalose mitigates triglyceride accumulation in multiple in vitro models of steatosis. A. Triglyceride (TG) quantification in hepatocytes treated with or without 5 mM fructose in the presence or absence of 100 mM trehalose. Data are shown as mean ± SEM for, N = 3 independent experiments, n = 3 replicates per treatment group per experiment. ***, P < 0.001 (one-way ANOVA and Sidak’s post hoc analysis). B. Quantitative, real-time RT-PCR (qPCR) analysis of carbohydrate response element binding protein (ChREBP) and glycerol phosphate acyltransferase (GPAT) mRNA in hepatocytes treated with fructose in the presence or absence of 100mM trehalose. Target abundances are normalized to α-actin expression within each sample. Data are shown as mean ± SEM for, N = 3 independent experiments, n = 3 replicates per treatment group per experiment. ****, P < 0.0001, ***, P < 0.001, and *, P < 0.05 (one-way ANOVA and Sidak’s post hoc analysis). C. TG quantification in hepatocytes treated with or without BSA-conjugated fatty acids (500μM) in the presence or absence of 100mM trehalose (48hr). Data are shown as mean ± SEM for, N = 3 independent experiments, n = 2–3 replicates per treatment group per experiment. ***, P < 0.001, (one-way ANOVA and Sidak’s post hoc analysis). D. TG quantification in microsomal triglyceride transfer protein-deficient primary hepatocytes treated with or without 100mM trehalose (48hr). ****, P < 0.0001 by 2-tail T-Test. Data are shown as mean ± SEM for, N = 3 independent experiments, n = 3 replicates per treatment group per experiment. E., TG quantification in WT and ATG16L1HM hepatocytes treated with BSA alone (control) or with BSA-conjugated fatty acids in the presence or absence of trehalose (100mM, 48hr). Data are shown as mean ± SEM for, N = 3 independent experiments, n = 3 replicates per treatment group per experiment. ****, P < 0.0001 by one-way ANOVA and Sidak’s post-hoc test.
Figure 5
Figure 5
Trehalose reduces HFrD-induced hepatic steatosis in vivo. A. 8 week-old mice were fed chow, 10-day 60% fructose diet or 10-day 60% fructose diet initiated two days after initiating 3% trehalose fed ad libitum in drinking water. Fasting plasma triglycerides, cholesterol and free fatty acids were quantified. Data are shown as mean ± SEM for, N = 6–12 indepedendent mice per treatment group. ***, P < 0.001 (one-way ANOVA and Sidak’s post hoc analysis). B. Left, Oil Red-O staining in frozen liver sections from mice described above. Scale bar, 200μm. Right, Blinded-observer quantification of staining red staining density (minimum 3 random fields from three cryosections obtained from three different mice per group) by ImageJ (version 1.47) densitometry software. Data are shown as mean ± SEM for, N = 9–12 mice per treatment group. ****, P < 0.0001 (one-way ANOVA and Sidak’s post hoc analysis). C. Hepatic TG, cholesterol and FFA quantification in 8 week-old mice fed chow, 10-day 60% fructose diet or 10-day 60% fructose diet initiated two days after initiating 3% trehalose fed ad libitum in drinking water. Data are shown as mean ± SEM for, N = 9–12 mice per treatment group. ****, P < 0.0001, ***, P < 0.001, and **, P < 0.01 (one-way ANOVA and Sidak’s post hoc analysis). D.Left to right, qPCR analysis of acyl-CoA carboxylase-1 (ACC1), stearyl-coA desaturase-1 (SCD1), glycerol phosphate acyltransferase (GPAT) and peroxisome proliferator antigen receptor-gamma (PPARγ) mRNA in liver tissue mRNA extracted from mice fed 10-day HFrD with or without 3% trehalose water. Target abundances are normalized to α-actin expression within each sample. Data are shown as mean ± SEM for, N = 9–12 mice per treatment group. ****, P < 0.0001, ***, P < 0.001, **, P < 0.01 and *, P < 0.05 (one-way ANOVA and Sidak’s post hoc analysis).
Figure 6
Figure 6
GLUT8 and AMPK mediate trehalose-induced autophagy and protection from triglyceride accumulation. A. LC3B-II immunoblots in hepatocyte lysates following adenoviral GFP, GLUT8 or GLUT2 expression. B. Quantitative triglyceride measurements in hepatocytes treated with or without 5mM fructose in the presence or absence of 100mM trehalose after adenoviral expression of GFP, GLUT8 or GLUT2. Data are shown as mean ± SEM for, N = 3 independent experiments, n = 2 replicates per experiment. ****, P < 0.0001, ***, P < 0.001, and *, P < 0.05 (one-way ANOVA and Sidak’s post hoc analysis). C. Above, immunoblot depicting phosphorylated ULK1 (Ser317) in trehalose-treated hepatocytes expressing a kinase-dead AMPK mutant (KD-AMPK). Below, pULK1 band density quantification, normalized to ULK1 band density. Data are shown as mean ± SEM for, N = 3 independent experiments, n = 1–3 replicates per experiment. ****, P < 0.0001 between bracketed groups (2-tailed T-Test). D. Above, immunoblot of LC3B-II accumulation in 100mM trehalose-treated hepatocytes (1hr) expressing KD-AMPK. Below, quantification of LC3B-II band normalized to GAPDH. *, P < 0.05 and N.S., not significantly different versus growth media group (2-tailed T-Test). E. Quantitative triglyceride measurements in hepatocytes treated with or without 5 mM fructose in the presence or absence of 100mM trehalose (48hr) after adenoviral expression of GFP or KD-AMPK. Data are shown as mean ± SEM for, N = 3 independent experiments, n = 3 replicates per experiment. ****, P < 0.0001, ***, P < 0.001 *, P < 0.05 (one-way ANOVA and Sidak’s post hoc analysis). F. Proposed model depicting trehalose blockade of GLUT2 and GLUT8, resulting in AMPK and ULK1 activation, and enhanced autophagic flux.

References

    1. Loomba R, Sanyal AJ. The global NAFLD epidemic. Nat Rev Gastroenterol Hepatol. 2013;10:686–90. - PubMed
    1. Debosch BJ, Chen Z, Saben JL, Finck BN, Moley KH. Glucose transporter 8 (GLUT8) mediates fructose-induced de novo lipogenesis and macrosteatosis. J Biol Chem. 2014;289:10989–98. - PMC - PubMed
    1. Mueckler M, Thorens B. The SLC2 (GLUT) family of membrane transporters. Mol Aspects Med. 2013;34:121–38. - PMC - PubMed
    1. Towler MC, Hardie DG. AMP-activated protein kinase in metabolic control and insulin signaling. Circ Res. 2007;100:328–341. - PubMed
    1. Russell RC, Yuan HX, Guan KL. Autophagy regulation by nutrient signaling. Cell Res. 2014;24:42–57. - PMC - PubMed

Publication types

Substances