. 2016 Feb 24:7:10822.
doi: 10.1038/ncomms10822.

FAT1 mutations cause a glomerulotubular nephropathy

Affiliations

FAT1 mutations cause a glomerulotubular nephropathy

Heon Yung Gee et al. Nat Commun. .

Abstract

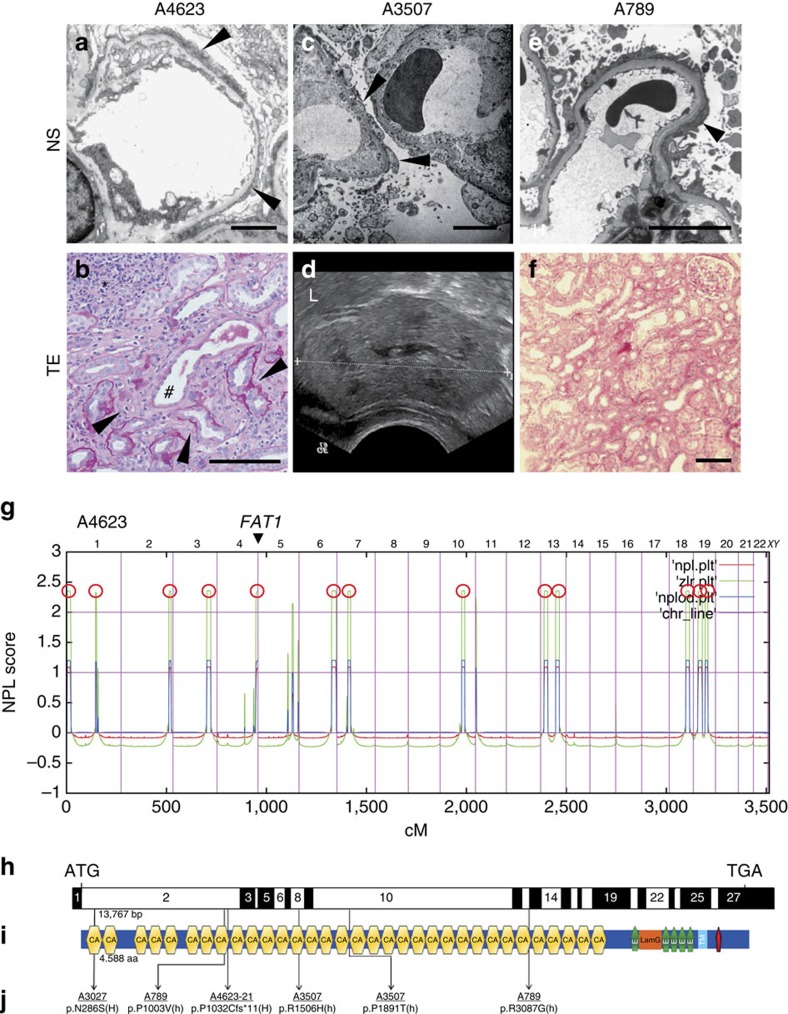
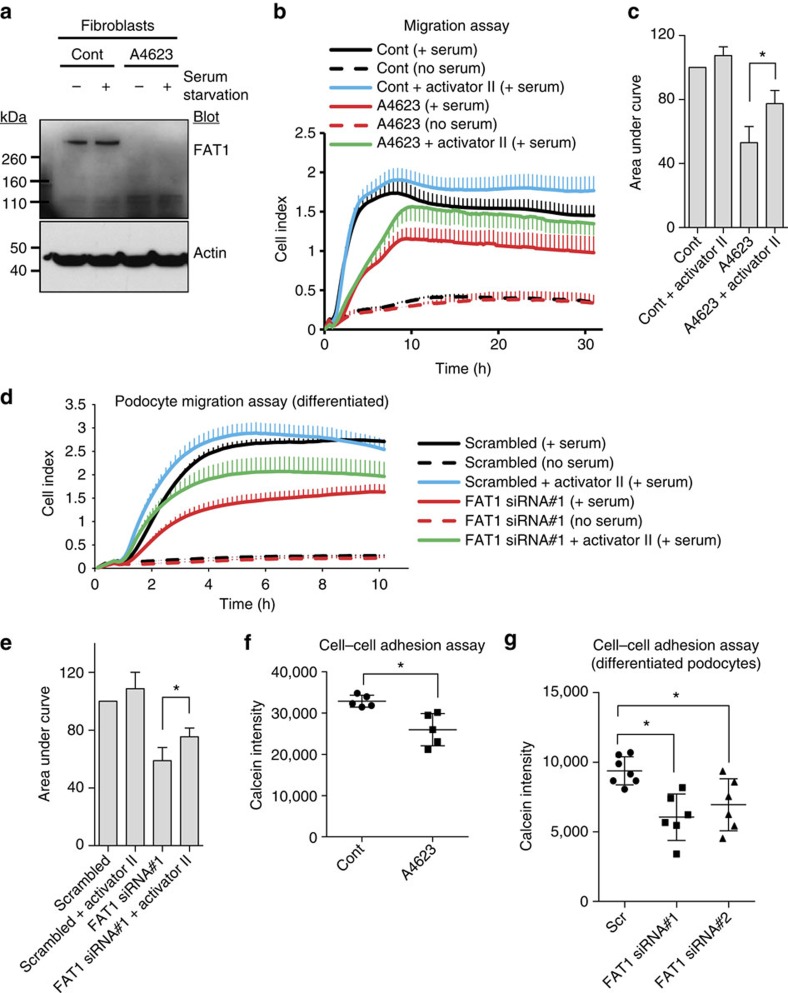
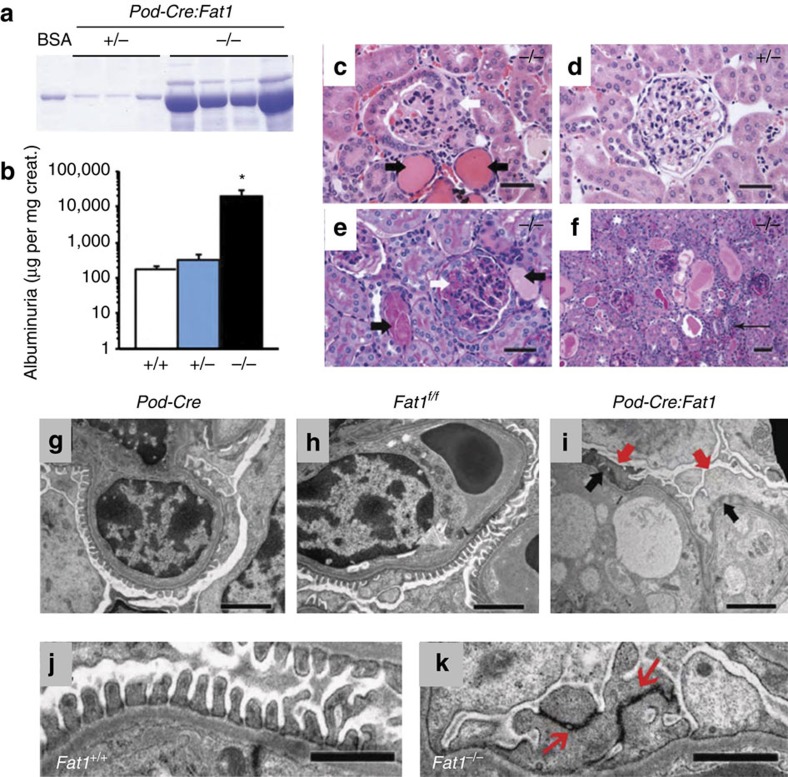
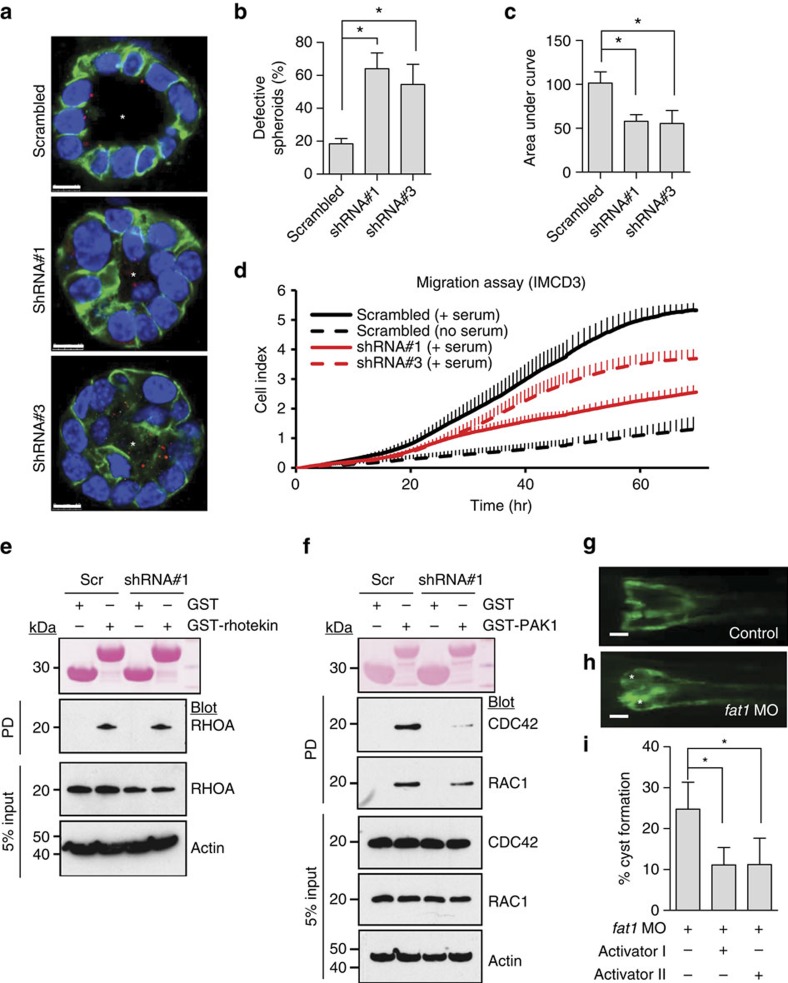
Steroid-resistant nephrotic syndrome (SRNS) causes 15% of chronic kidney disease (CKD). Here we show that recessive mutations in FAT1 cause a distinct renal disease entity in four families with a combination of SRNS, tubular ectasia, haematuria and facultative neurological involvement. Loss of FAT1 results in decreased cell adhesion and migration in fibroblasts and podocytes and the decreased migration is partially reversed by a RAC1/CDC42 activator. Podocyte-specific deletion of Fat1 in mice induces abnormal glomerular filtration barrier development, leading to podocyte foot process effacement. Knockdown of Fat1 in renal tubular cells reduces migration, decreases active RAC1 and CDC42, and induces defects in lumen formation. Knockdown of fat1 in zebrafish causes pronephric cysts, which is partially rescued by RAC1/CDC42 activators, confirming a role of the two small GTPases in the pathogenesis. These findings provide new insights into the pathogenesis of SRNS and tubulopathy, linking FAT1 and RAC1/CDC42 to podocyte and tubular cell function.


Figures

Figure 1
Figure 1. FAT1 mutations cause a glomerulotubular nephropathy.
(a) Electron microscopy in A4623 with FAT1 mutation demonstrates the nephrotic syndrome (NS) feature of foot process effacement (arrowheads). Scale bar, 5 μm. (b) Renal histology of individual A4623 exhibits cystic dilation of renal tubules (hash), interstitial infiltrations (asterisks), and tubular basement membrane disruptions (arrowheads). Scale bar, 100 μm. (c) In A3507 with FAT1 mutation electron microscopy reveals the NS feature of extensive foot process effacement with microvilli formation (arrowheads). Scale bar, 5 μm. (d) Renal ultrasound of individual A3507 demonstrates loss of corticomedullary differentiation and increased echogenicity (L, liver). (e) Electron microscopy of A789 shows foot process effacement (arrowheads). Scale bar, 5 μm. (f) Renal histology of A789 shows tubulointerstitial infiltrates. Scale bar, 100 μm. (g) Homozygosity mapping identified 13 recessive candidate loci in individual A4623 with NS and tubular ectasia (TE). Non-parametric lod scores (NPL) were calculated and plotted across the human genome. The x-axis shows Affymetrix 250 K StyI array SNP positions on human chromosomes concatenated from p-ter (left) to q-ter (right). Genetic distance is given in cM. 13 maximum NPL peaks (red circles) indicate candidate regions of homozygosity by descent. The FAT1 locus (arrowhead) is positioned within the maximum NPL peak on chromosome 4q. (h) Exon structure of human FAT1 cDNA. FAT1 contains 27 exons. Positions of start codon (ATG) and of stop codon (TGA) are indicated. (i) Domain structure of FAT1. Protein domains are depicted by coloured bars in relation to encoding exon positions (h). FAT1 contains 33 cadherin domains (CA), a laminin G domain (LamG) and five epidermal growth factor (EGF)-like repeat domains (green bullets) in its extracellular region, followed by a transmembrane region (light blue bar) and a C-terminal cytoplasmic domain containing a PTB-like motif (red bar) with a PDZ-binding motif (-HTEV). (j) Two homozygous (H) and four different compound-heterozygous FAT1 mutations (h) detected in four families with a glomerulotubular nephropathy. Family numbers (underlined), mutations and predicted translational changes are indicated (see also Table 1).
Figure 2
Figure 2. Loss of FAT1 causes defects in migration and cell–cell adhesion in fibroblasts and cultured podocytes.
(a) Cell lysates from fibroblasts of individuals A4623 were collected and protein level of FAT1 was analysed by western blotting with FAT1–GST antibody. FAT1–GST antibody recognizes the intracellular domain of FAT1 (C-terminal 385 aa of mouse FAT1), thus demonstrating the deficiency of the truncated FAT1 protein (p.P1032Cfs*11) resulting from c.3093_3096del FAT1 mutation in A4623. (b) Cell migration assay using the xCELLigence system. Fibroblasts from A4623 show decreased migration compared with control. Note that the decrease in migration of A4623 fibroblasts was partially rescued by the RAC/CDC42 activator II. Each cell index value corresponds to the average of more than triplicates and s.d. is in only one direction for clarity. (c) Bar graphs represent the area under curves of b and data respresent the mean+s.d. of three independent experiments. *P<0.05, t-test. (d) Effect of FAT1 knockdown on podocyte migration. Differentiated cultured human podocytes transfected with FAT1 siRNA exhibited decreased migration (red line) compared with scrambled siRNA controls (black line). Decreased podocyte migration due to FAT1 knockdown was partially rescued by RAC/CDC42 activator II (green line). Each cell index value corresponds to the average of more than triplicates and s.d. is in only one direction for clarity. (e) Bar graphs represent the area under curves of d and data respresent the mean+s.d. of three independent experiments. *P<0.05, t-test. (f) Cell–cell adhesion assay using calcein AM demonstrated that decreased cell–cell adhesion in fibroblasts from individual A4623 compared with control fibroblasts. Data respresent the mean±s.d. of more than five independent experiments in f and g. *P<0.05; t-test. (g) Knockdown of FAT1 by two different siRNAs in differentiated podocytes resulted in decreased cell–cell adhesion in the calcein AM assay.
Figure 3
Figure 3. Podocyte-specific Fat1 deletion causes massive proteinuria and FSGS in adult mice.
(a) Urine (5 μl) resolved by SDS–PAGE and stained with Coomassie blue shows massive albuminuria in podocyte-Fat1−/− mutants as quantitated in (b) BSA=1 μg bovine serum albumin. The number of mice studies in ac were: n=10 (+/+, 5 Pod-Cre and 5 Fat1f/f); n=4 (Pod-Cre:Fat1+/-); n=5 (Pod-Cre:Fat1−/−). The experimental groups were compared by analysis of variance. *P<0.05, t-test. (c) On H&E staining, Fat1−/− show focal glomerular sclerosis (white arrow) and protein casts (black arrows) compared with Fat1+/- (d). (e,f) On PAS staining, Fat1−/− kidneys show focal glomerular sclerosis (white arrows), protein casts (black arrows) and interstitial infiltrates (thin arrow). (cf) Scale bars, 40 μm. (gh) On TEM, Pod-Cre and Fat1f/f single transgenic kidneys show normal glomerular filtration barrier ultrastructure. (i) Fat1−/− kidneys exhibit complete foot process effacement (red arrows), absence of slit-diaphragms and F-actin collapse in podocytes (black arrows). GBM and endothelium are intact. (j) Fat1+/+ kidneys show normal glomerular filtration barrier ultrastructure; (k) In Pod-Cre:Fat1−/−, glomeruli tight junctions (red arrows) link the effaced foot processes. Scale bars, 2 μm (gi); and 1 μm (hk).
Figure 4
Figure 4. Loss of FAT1 causes a renal tubular phenotype via defective RHO GTPase signalling.
(a) IMCD3 cells ciliated apically and formed a spheroid containing a central lumen (asterisk) when grown in 3D matrigel culture for 3 days; lumens were perturbed on Fat1 knockdown (shRNA#1 and shRNA#3). Cells were stained for acetylated α-tubulin (red), β-catenin (green) and DAPI (blue). Scale bars, 10 μm. (b) Percentage of abnormal spheroids. More than 50 spheroids were examined in each experiment. Data represent the mean+s.d. of three independent experiments in b,c. *P<0.05, t-test. (c) The effect of Fat1 knockdown on cell migration. Bar graphs represent the area under curves of d. (d) The effect of Fat1 knockdown on cell migration. Compared with baseline (dashed black line), addition of serum strongly increases migration rate in IMCD3 cells with scrambled shRNA (Scr) (solid black line). In contrast, IMCD3 cells stably transfected with Fat1 shRNAs #1 (red continuous line) or #3 (red dashed line) exhibited slower rate of migration. Each cell index value corresponds to the average of more than triplicates and s.d. is in only one direction for clarity. (e) Active GTP-bound RHOA precipitated from IMCD3. Cells transfected with scrambled control siRNA versus Fat1 shRNA exhibited no significant difference in relative RHOA activity. This is representative of three experiments. (f) Active GTP-bound CDC42 or RAC1 using a GST–PAK1 (CRIB) pull-down assay. Note that Fat1 knockdown leads to a significant decrease in relative CDC42 and RAC1 (31% and 44%, respectively) compared with Scr control cells. This is representative of four experiments. Quantification of e and f is presented in Supplementary Fig. 7. (gh) fat1 morpholino-oligonucelotide (MO) was injected to Wt1b::GFP transgenic zebrafish. Zebrafish injected with control MO did not produce any phenotype. Depletion of fat1 by a fat1 MO targeting the translation initiation site of zebrafish fat1 caused pronephric cysts (asterisks) in 78 of 325 zebrafish embryos (24%). Scale bars, 100 μm. (i) Activator I (Rho/Rac/Cdc42 activator I) reduced cyst formation to 9.7% (26 of 268 embryos), and activator II (Rac/Cdc42 activator II) to 12.0% (59 of 490 embryos). *P<0.001, χ2-test.

References

    1. Smith J. M., Stablein D. M., Munoz R., Hebert D. & McDonald R. A. Contributions of the transplant registry: The 2006 Annual Report of the North American Pediatric Renal Trials and Collaborative Studies (NAPRTCS). Pediatr. Transplant. 11, 366–373 (2007). - PubMed
    1. Ruf R. G. et al.. Patients with mutations in NPHS2 (podocin) do not respond to standard steroid treatment of nephrotic syndrome. J. Am. Soc. Nephrol. 15, 722–732 (2004). - PubMed
    1. Hildebrandt F. & Heeringa S. F. Specific podocin mutations determine age of onset of nephrotic syndrome all the way into adult life. Kidney Int. 75, 669–671 (2009). - PubMed
    1. Somlo S. & Mundel P. Getting a foothold in nephrotic syndrome. Nat. Genet. 24, 333–335 (2000). - PubMed
    1. Tryggvason K., Patrakka J. & Wartiovaara J. Hereditary proteinuria syndromes and mechanisms of proteinuria. N. Engl. J. Med. 354, 1387–1401 (2006). - PubMed

Publication types

MeSH terms

Supplementary concepts