. 2016 Feb 24:7:10842.
doi: 10.1038/ncomms10842.

The role of kinetic context in apparent biased agonism at GPCRs

Affiliations

The role of kinetic context in apparent biased agonism at GPCRs

Carmen Klein Herenbrink et al. Nat Commun. .

Abstract

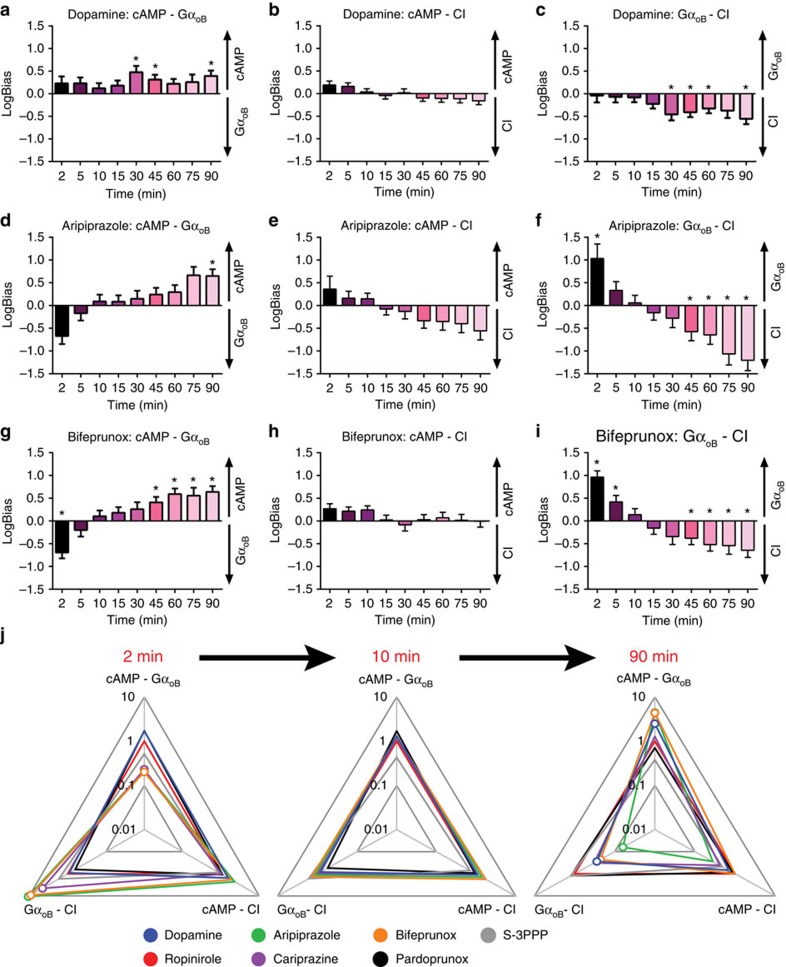
Biased agonism describes the ability of ligands to stabilize different conformations of a GPCR linked to distinct functional outcomes and offers the prospect of designing pathway-specific drugs that avoid on-target side effects. This mechanism is usually inferred from pharmacological data with the assumption that the confounding influences of observational (that is, assay dependent) and system (that is, cell background dependent) bias are excluded by experimental design and analysis. Here we reveal that 'kinetic context', as determined by ligand-binding kinetics and the temporal pattern of receptor-signalling processes, can have a profound influence on the apparent bias of a series of agonists for the dopamine D2 receptor and can even lead to reversals in the direction of bias. We propose that kinetic context must be acknowledged in the design and interpretation of studies of biased agonism.


Figures

Figure 1
Figure 1. Kinetic traces of the cellular response on activation of the D2LR with various agonists.
The effect of dopamine (10 μM), ropinirole (10 μM), aripiprazole (10 μM), cariprazine (1 μM), bifeprunox (10 μM), pardoprunox (10 μM) and S-3PPP (10 μM) on ERK1/2 phosphorylation (a), the inhibition of forskolin-induced cAMP production (b), β-arrestin-2 recruitment (c), activation of GαoB (d) and Gαi1 (e) G proteins, and CI (f) is shown for a period of 30–90 min. The data points are expressed as mean±s.e.m. from three (cAMP, GαoB, Gαi1 and β-arrestin-2 recruitment) or four (ERK1/2 phosphorylation and CI) experiments performed in duplicate. Duplicates were averaged before calculating s.e.m. The raw data are included as Supplementary Data 1.
Figure 2
Figure 2. Characterization of D2R agonists at a range of signalling endpoints after 5 min of agonist stimulation.
The ability of increasing concentrations of D2R agonists to induce ERK1/2 phosphorylation (a), inhibit 10 μM forskolin-induced cAMP production (b), induce β-arrestin2 recruitment (c), activate GαoB (d) and Gαi1 (e) G proteins and induce changes in CI (f) in Flp-In-CHO cells expressing the D2LR. The data were normalized to the maximal response induced by dopamine and fitted using an operational model of agonism (equation (2)). The values are expressed as mean±s.e.m. of three experiments performed in duplicate; duplicates were averaged before calculating s.e.m.
Figure 3
Figure 3. Quantification of biased agonism relative to dopamine at a 5-min time point reveals a distinct pattern of bias for D2R partial agonists.
The concentration-response curves for various dopaminergic ligands at five different signalling endpoints were analysed using an operational model of agonism to obtain transduction coefficients (Log(τ/KA); Supplementary Table 1). These were normalized to the reference agonist dopamine (ΔLog(τ/KA); Supplementary Table 2) and then values obtained for one agonist at two different pathways were subtracted to obtain LogBias values (ΔΔLog(τ/KA); Supplementary Table 3). (a) Bias values (10LogBias) obtained for the agonists between the inhibition of forskolin-induced cAMP production, ERK1/2 phosphorylation, G protein activation and induction of changes in CI presented in Supplementary Table 3 are shown in a web of bias. Open circles indicate significant differences between values of ΔLog(τ/KA) determined at different pathways for a particular ligand, determined by a one-way analysis of variance (ANOVA) with a Tukey's post test (P<0.05). (b) A principal component analysis plot projecting the relative positions of the ligands according to the LogBias values onto the first two principal components (PC1, 90% and PC2, 7%).
Figure 4
Figure 4. Biased agonists have a longer residence time at the D2R compared to dopamine.
Kinetic binding parameters of kon (a), koff (b) and t1/2 (c) were determined in a competition kinetic binding assay using a Tag-lite binding assay and the fluorescently labelled agonist PPHT as the tracer ligand (Supplementary Table 6). (d) A value of affinity for each ligand was calculated using these parameters and compared with that obtained in competition-binding studies using [3H]spiperone as the tracer ligand (Supplementary Table 5). All values are expressed as mean±s.e.m. from three experiments. (e) The values of kon and koff obtained in the competition kinetic assay were used to simulate receptor occupancy over time using equation (9) and the concentration of ligand equivalent to its KD (see Supplementary Table 6).
Figure 5
Figure 5. D2R agonists display distinct assay-dependent changes in potency over time.
The response induced by various concentrations of dopamine (ac), ropinirole (df), aripiprazole (gi) and bifeprunox (jl) by Flp-In-CHO cells stably expressing the D2LR was determined at a range of time points between 2 and 90 min. Agonist effects were measured on the inhibition of forskolin-induced cAMP production (a,d,g,j), activation of GαoB G proteins (b,e,h,k) and changes in CI (c,f,i,l). The data were normalized to the maximal response induced by ropinirole. The values are expressed as mean±s.e.m. from three experiments performed in duplicate; duplicates were averaged before calculating s.e.m. The average potency (pEC50) and Emax for each drug at each time point are displayed in Supplementary Table 7.
Figure 6
Figure 6. The observed bias determined for aripiprazole changes over time.
The concentration–response curves for bifeprunox and aripiprazole at different incubation time points were analysed using an operational model of agonism to obtain transduction coefficients (Log(τ/KA)). These were normalized to the corresponding value obtained for the reference agonist ropinirole at the various time points (ΔLog(τ/KA)) and then the normalized values obtained for one agonist at two different pathways were subtracted to obtain LogBias values (ΔΔLog(τ/KA)) at the various different time points. These LogBias values obtained for dopamine (ac), aripiprazole (df) and bifeprunox (gi) in reference to ropinirole are represented in bar graphs. Comparisons of agonist action are made between the inhibition of forskolin-stimulated cAMP production versus activation of GαoB G proteins (a,d,g) or CI (CI, b,e,h), and activation of GαoB G proteins versus CI (c,f,i). *Significant differences between values of ΔLog(τ/KA) determined at the two different pathways for a particular ligand, determined by a one-way analysis of variance (ANOVA) with a Tukey's post test (P<0.05). The changes in overall bias profiles of all compounds are illustrated by webs of bias constructed from data in ai at 2, 10 and 90 min. (j) The values are expressed as mean±s.e.m. obtained from three experiments performed in duplicate; duplicates were averaged before calculating s.e.m. Open circles indicate significant differences between values of ΔLog(τ/KA) determined at different pathways for a particular ligand, determined by a one-way ANOVA with a Tukey's post test (P<0.05).
Figure 7
Figure 7. Differences in observation bias can explain discrepancies in prior studies of biased agonism.
Experiments measuring ERK phosphorylation using an Alphascreen assay were measured after 5 min of agonist stimulation at 37 °C, whereas experiments measuring inhibition of forskolin-stimulated cAMP using the BRET CAMYEL biosensor were measured at various time points between 2 and 30 min at either 25 or 37 °C. These data were used to determine transduction coefficients (Log(τ/KA)) for the different agonists at the different time points and different assays. The effect of temperature on the ΔLog(τ/KA) values of ropinirole (a), pardoprunox (b), S-3PPP (c), aripiprazole (d), cariprazine (e) and bifeprunox (f) was determined at various time points using the BRET cAMP assay in reference to dopamine. *P<0.05, significant difference between the ΔLog(τ/KA) values determined at 25 and 37 °C as evaluated by a Student's unpaired two-tailed t-test. The effect of temperature on biased agonism of aripiprazole (g), cariprazine (h) and bifeprunox (i) over time between ERK1/2 phosphorylation (5 min, 37 °C) and the inhibition of cAMP production (x') in reference to dopamine was evaluated. The values are expressed as mean±s.e.m. obtained from three experiments performed in duplicate; duplicates were averaged before calculating s.e.m. *P<0.05, significantly different from the reference agonist dopamine at each time point determined by a Student's unpaired two-tailed t-test.
Figure 8
Figure 8. The impact of kinetic bias on the energy landscape of a GPCR.
A receptor may adopt different conformations as it engages different signalling effector and regulatory proteins. Agonists may have different association and dissociation kinetics, which determine the residence time of the agonist on the receptor. The duration of a ligand–receptor complex may determine the different effector and regulatory proteins that can be engaged over time and thus the conformational landscape that can be explored by that agonist–receptor complex over time.

References

    1. Whalen E. J., Rajagopal S. & Lefkowitz R. J. Therapeutic potential of β-arrestin- and G protein-biased agonists. Trends Mol. Med. 17, 126–139 (2011). - PMC - PubMed
    1. Kenakin T. & Christopoulos A. Signalling bias in new drug discovery: detection, quantification and therapeutic impact. Nat. Rev. Drug Discov. 12, 205–216 (2013). - PubMed
    1. Urban J. D. et al.. Functional selectivity and classical concepts of quantitative pharmacology. J. Pharmacol. Exp. Ther. 320, 1–13 (2007). - PubMed
    1. Overington J. P., Al-Lazikani B. & Hopkins A. L. How many drug targets are there? Nat. Rev. Drug Discov. 5, 993–996 (2006). - PubMed
    1. Violin J. D., Crombie A. L., Soergel D. G. & Lark M. W. Erratum: biased ligands at G protein-coupled receptors: promise and progress. Trends Pharmacol. Sci. 35, 308–316 (2014). - PubMed

Publication types