

Differential scanning fluorimetry based assessments of the thermal and kinetic stability of peptide-MHC complexes
- PMID: 26906089
- PMCID: PMC4837003
- DOI: 10.1016/j.jim.2016.02.016
Differential scanning fluorimetry based assessments of the thermal and kinetic stability of peptide-MHC complexes
Abstract
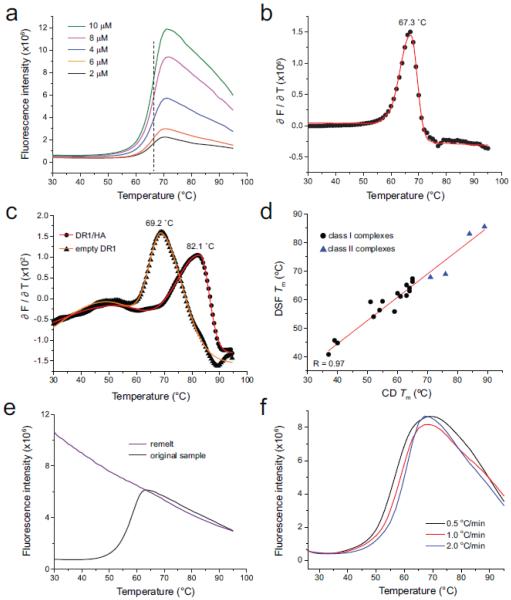
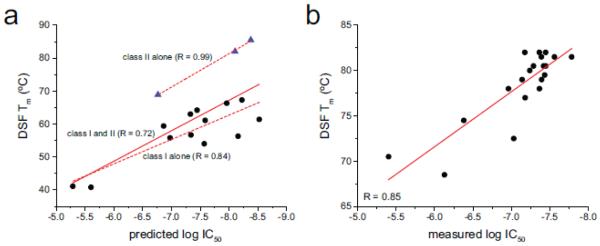
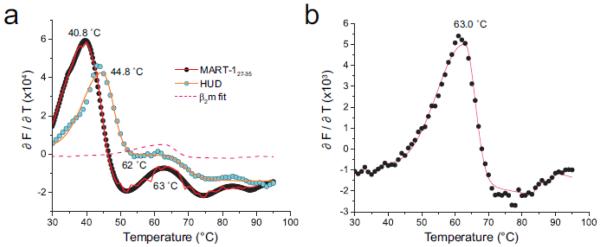
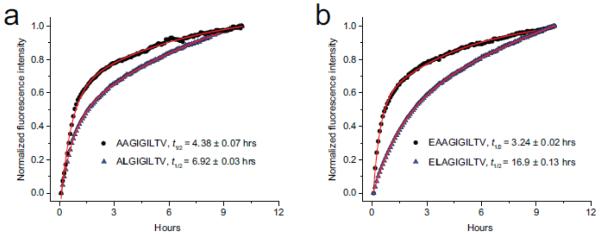
Measurements of thermal stability by circular dichroism (CD) spectroscopy have been widely used to assess the binding of peptides to MHC proteins, particularly within the structural immunology community. Although thermal stability assays offer advantages over other approaches such as IC50 measurements, CD-based stability measurements are hindered by large sample requirements and low throughput. Here we demonstrate that an alternative approach based on differential scanning fluorimetry (DSF) yields results comparable to those based on CD for both class I and class II complexes. As they require much less sample, DSF-based measurements reduce demands on protein production strategies and are amenable for high throughput studies. DSF can thus not only replace CD as a means to assess peptide/MHC thermal stability, but can complement other peptide-MHC binding assays used in screening, epitope discovery, and vaccine design. Due to the physical process probed, DSF can also uncover complexities not observed with other techniques. Lastly, we show that DSF can also be used to assess peptide/MHC kinetic stability, allowing for a single experimental setup to probe both binding equilibria and kinetics.
Keywords: Binding affinity; Differential scanning fluorimetry; Kinetic stability; MHC protein; Thermal stability.
Copyright © 2016 Elsevier B.V. All rights reserved.
Figures
References
-
- Álvaro-Benito M, Wieczorek M, Sticht J, Kipar C, Freund C. HLA-DMA Polymorphisms Differentially Affect MHC Class II Peptide Loading. The Journal of Immunology. 2015;194:803–816. - PubMed
-
- Baxter TK, Gagnon SJ, Davis-Harrison RL, Beck JC, Binz A-K, Turner RV, Biddison WE, Baker BM. Strategic mutations in the class I MHC HLA-A2 independently affect both peptide binding and T cell receptor recognition. J. Biol. Chem. 2004;279:29175–29184. - PubMed
-
- Binz AK, Rodriguez RC, Biddison WE, Baker BM. Thermodynamic and kinetic analysis of a peptide-class I MHC interaction highlights the noncovalent nature and conformational dynamics of the class I heterotrimer. Biochemistry. 2003;42:4954–61. - PubMed
Publication types
MeSH terms
Substances
Grants and funding
- CA153789/CA/NCI NIH HHS/United States
- F30 CA180731/CA/NCI NIH HHS/United States
- R01 AI038996/AI/NIAID NIH HHS/United States
- GM103773/GM/NIGMS NIH HHS/United States
- AI038996/AI/NIAID NIH HHS/United States
- CA154778/CA/NCI NIH HHS/United States
- CA180731/CA/NCI NIH HHS/United States
- UL1 TR001108/TR/NCATS NIH HHS/United States
- R56 AI038996/AI/NIAID NIH HHS/United States
- R01 GM067079/GM/NIGMS NIH HHS/United States
- R21 CA153789/CA/NCI NIH HHS/United States
- P01 CA154778/CA/NCI NIH HHS/United States
- R37 AI038996/AI/NIAID NIH HHS/United States
- TR001108/TR/NCATS NIH HHS/United States
- GM067079/GM/NIGMS NIH HHS/United States
- R01 GM103773/GM/NIGMS NIH HHS/United States
LinkOut - more resources
Full Text Sources
Other Literature Sources
Molecular Biology Databases
Research Materials
