. 2016 Apr 13;16(4):2369-74.
doi: 10.1021/acs.nanolett.5b05139. Epub 2016 Mar 1.

Programming Light-Harvesting Efficiency Using DNA Origami

Affiliations

Programming Light-Harvesting Efficiency Using DNA Origami

Elisa A Hemmig et al. Nano Lett. .

Abstract

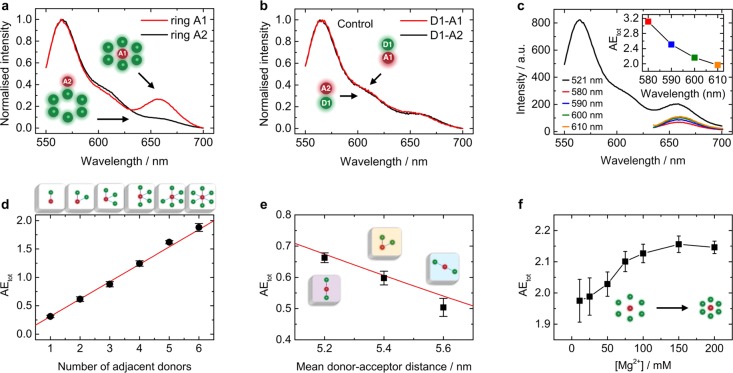
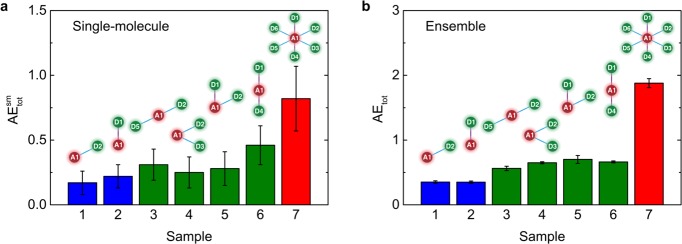
The remarkable performance and quantum efficiency of biological light-harvesting complexes has prompted a multidisciplinary interest in engineering biologically inspired antenna systems as a possible route to novel solar cell technologies. Key to the effectiveness of biological "nanomachines" in light capture and energy transport is their highly ordered nanoscale architecture of photoactive molecules. Recently, DNA origami has emerged as a powerful tool for organizing multiple chromophores with base-pair accuracy and full geometric freedom. Here, we present a programmable antenna array on a DNA origami platform that enables the implementation of rationally designed antenna structures. We systematically analyze the light-harvesting efficiency with respect to number of donors and interdye distances of a ring-like antenna using ensemble and single-molecule fluorescence spectroscopy and detailed Förster modeling. This comprehensive study demonstrates exquisite and reliable structural control over multichromophoric geometries and points to DNA origami as highly versatile platform for testing design concepts in artificial light-harvesting networks.

Keywords: DNA nanotechnology; DNA origami; Förster resonance energy transfer; artificial light-harvesting; fluorescence spectroscopy.


Conflict of interest statement

The authors declare no competing financial interest.

Figures

Figure 1
Figure 1
Systematic design of DNA origami based donor–acceptor geometries. (a) Ring of Cy3 donor dyes (green) surrounds a Cy5 acceptor dye (red) on a flat, square-shaped DNA origami platform. The zoomed-in window shows the precise fluorophore attachment sites using a caDNAno scheme. (b) For each number of donors N, we created all six permutations of adjacent donor positions (gray boxes) and prepared a control sample containing an acceptor only (gray frame). For N = 2, we assembled all the possible dye geometries resulting in three groups of different mean donor–acceptor distances (colored boxes). The seven structures highlighted with black frames are analyzed both in ensemble and single-molecule measurements.
Figure 2
Figure 2
Light-harvesting efficiency depends on donor–acceptor geometry. (a) Normalized fluorescence emission spectra with acceptor inside (ring A1, red line) and outside (ring A2, black line) the donor ring. (b) Normalized fluorescence emission spectra of corresponding donor–acceptor pairs with donor fixed at D1 and acceptor at A1 (D1A1, red line) and at A2 (D1A2, black line). (c) Fluorescence emission spectra of the six-donor ring with an acceptor in the center when excited at different wavelengths. The black line corresponds to the emission when excited at the Cy3 (donor) excitation wavelength at 521 nm. The colored lines correspond to the emission at direct Cy5 (acceptor) excitation at different wavelengths in the range 580–610 nm. Inset: Antenna effect (AEtot) as a function of the acceptor excitation wavelength. (d) AEtot in dependence of number of adjacent donors N with linear fit (red line) according to eq 4. For each N, we averaged over all possible combinations of adjacent donors in the ring (Figure 1b). The error bars correspond to the standard error of the mean. (e) AEtot as a function of mean donor-to-acceptor distance as determined from the two-donor samples (Figure 1b). We prepared three independent replicates of each sample type. The error bars correspond to the standard error of the mean. The function (red line) shows the theoretical distance dependence of AEtot (eq 5). (f) Influence of the concentration of Mg2+ ions in the buffer solution on AEtot for the six-donor ring with an acceptor in the center. An increase in Mg2+ ion concentration is known to shrink the interhelix distances in DNA origami structures. We prepared three independent replicates of the sample. The error bars correspond to the standard error of the mean.
Figure 3
Figure 3
Direct comparison between single-molecule and ensemble fluorescence measurements. (a) Antenna effect (AEtotsm) obtained from single-molecule measurements. We analyzed one-donor (blue), two-donor (green), and six-donor (red) samples (Figure 1b). We screened several thousand molecules for each sample type, and used a Gaussian fit to determine the antenna effect. The error bars correspond to the standard deviation of the Gaussian fit. (b) Antenna effect (AEtot) obtained from ensemble measurements. We analyzed one-donor (blue), two-donor (green), and six-donor (red) samples (Figure 1b). Each sample was prepared in three independent replicates. The error bars correspond to the standard error of the mean.

References

    1. Blankenship R. E.Molecular Mechanisms of Photosynthesis; Blackwell Publishing Ltd.: Oxford, U. K., 2008.
    1. Scholes G. D.; Fleming G. R.; Olaya-Castro A.; van Grondelle R. Nat. Chem. 2011, 3, 763–774. 10.1038/nchem.1145. - DOI - PubMed
    1. Heller M. J.; Tullis R. H. Nanotechnology 1991, 2, 165.10.1088/0957-4484/2/4/001. - DOI
    1. Stein I. H.; Schüller V.; Böhm P.; Tinnefeld P.; Liedl T. ChemPhysChem 2011, 12, 689–695. 10.1002/cphc.201000781. - DOI - PubMed
    1. Stein I. H.; Steinhauer C.; Tinnefeld P. J. Am. Chem. Soc. 2011, 133, 4193–4195. 10.1021/ja1105464. - DOI - PubMed

Publication types