. 2016 Mar;19(3):366-74.
doi: 10.1038/nn.4240.

Confidence and certainty: distinct probabilistic quantities for different goals

Affiliations

Confidence and certainty: distinct probabilistic quantities for different goals

Alexandre Pouget et al. Nat Neurosci. 2016 Mar.

Abstract

When facing uncertainty, adaptive behavioral strategies demand that the brain performs probabilistic computations. In this probabilistic framework, the notion of certainty and confidence would appear to be closely related, so much so that it is tempting to conclude that these two concepts are one and the same. We argue that there are computational reasons to distinguish between these two concepts. Specifically, we propose that confidence should be defined as the probability that a decision or a proposition, overt or covert, is correct given the evidence, a critical quantity in complex sequential decisions. We suggest that the term certainty should be reserved to refer to the encoding of all other probability distributions over sensory and cognitive variables. We also discuss strategies for studying the neural codes for confidence and certainty and argue that clear definitions of neural codes are essential to understanding the relative contributions of various cortical areas to decision making.


Conflict of interest statement

COMPETING FINANCIAL INTERESTS

The authors declare no competing financial interests.

Figures

Figure 1
Figure 1
Confidence and certainty in a visuo-vestibular task. As described in the main text, assume that we are driving in dense traffic and that – based on visual cues, I, and vestibular cues about self-motion, V – we have to decide between veering to the left or right to avoid hitting a car braking in front of us. We determine the best course of action by inverting the generative model (left), which specifies how the choice-relevant latent variable z is assumed to have generated the observations I and V. In our case, z is either right or left, indicating the better direction to veer toward. This z is assumed to stochastically generate a heading direction θ relative to the braking car and compatible with z. The relative heading direction in turn generates the visual and vestibular observations. The generative model is inverted (right) to determine the probability of z = right or z = left given these observations, leading to the posterior distribution p(z|I, V). This posterior can in turn be used to determine the choice d(I, V), which, as the posterior, is a function of the observations. All probability distributions leading up to this choice determine the certainties about various variables involved in the decision-making process. The confidence in this choice, in contrast, is the probability that the choice itself is correct, that is, that the latent state z indeed corresponds to this choice, p(z = k, d = k, I, V). For more details, see Box 1.
Figure 2
Figure 2
Two distinct codes for certainty. Left, the encoded probability distribution, p(s|r), illustrated here for direction of motion s given the activity r of a neural population (in all panels, blue curve indicates low certainty and red curve indicates high certainty). Right, tuning curves of an individual neuron for two hypothetical neural codes. Top right, the width of the tuning curves is inversely proportional to certainty ( 1/σs2) about the stimulus. Bottom right, the amplitude of the tuning curve is proportional to certainty. Such code can be detected by regressing the variance of the posterior distribution against the width or amplitude of the tuning curves. Unfortunately, finding a significant correlation between certainty and some features of the tuning curves does not guarantee that this feature encodes certainty. It is instead preferable to use a decoding approach, as explained in the main text and Figure 4.
Figure 3
Figure 3
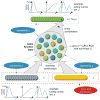
Nonlinear neural computations by neural populations that linearly represent variables. We say that a neural population represents a variable x if linear and nonlinear functions of x can be estimated linearly from the neural activity. This requires that the neurons have nonlinear tuning curves to x, such as the ones shown in the inset below population x. The network implements the nonlinear function z = (x, y) by first transforming the activity of the neural populations representing x and y (bottom, blue and yellow) into a basis function layer (central circle) whose neurons feature activities gj (x, y) that are nonlinear combinations of the activities of the two input populations. Second, neurons in the population representing z (top, green) combine the activities of the basis function neurons linearly, as illustrated by weights wk for neuron k. This population again represents z in a linearly decodable way by featuring nonlinear tuning curves with respect to z. Such a network can compute almost arbitrary nonlinear functions as long as the set of basis functions is sufficiently rich. The bottom neurons representing x and y together contain all the information to compute z, however do not represent z, as z can only be decoded with a nonlinear decoder from these neurons. The central neurons in the basis function layer represent x and y, as their activities can be used to compute f (x, y) = x and f (x, y) = y, which implies that both x and y are linearly decodable from this population. They also represent z, as the activities of neurons in the population z is only a linear transformation of the activity of neurons in the basis function network, making z linearly decodable from this network. Note that both input populations as well as the output population can be part of upstream and downstream basis function networks performing further computations. They are here shown as distinct entities only for the sake of illustration.
Figure 4
Figure 4
A Bayesian decoder provides a normative way to relate population activity (left) to the certainty (right). Left, activity of a population of motion selective neurons in response to one particular moving object. Right, corresponding posterior distribution over direction given the vector of activity r, obtained via an application of Bayes rule. Certainty corresponds to the s.d. of the posterior distribution. In some cases, the mapping from the neural activity to the log of the posterior distributions is linear in neural activity. This is what is known as a linear probabilistic population codes.

Similar articles

Cited by

References

    1. Kepecs A, Mainen ZF. A computational framework for the study of confidence in humans and animals. Phil Trans R Soc Lond B. 2012;367:1322–1337. - PMC - PubMed
    1. Meyniel F, Sigman M, Mainen ZF. Confidence as Bayesian probability: from neural origins to behavior. Neuron. 2015;88:78–92. - PubMed
    1. Grimaldi P, Lau H, Basso MA. There are things that we know that we know, and there are things that we do not know we do not know: Confidence in decision-making. Neurosci Biobehav Rev. 2015;55:88–97. - PMC - PubMed
    1. Vickers D. Decision Processes in Visual Perception. Academic Press; New York: 1979.
    1. Wei Z, Wang XJ. Confidence estimation as a stochastic process in a neurodynamical system of decision making. J Neurophysiol. 2015;114:99–113. - PMC - PubMed

Publication types

LinkOut - more resources