. 2016 Feb 22;36(4):462-75.
doi: 10.1016/j.devcel.2016.01.022.

Quantitative Multiscale Cell Imaging in Controlled 3D Microenvironments

Affiliations

Quantitative Multiscale Cell Imaging in Controlled 3D Microenvironments

Erik S Welf et al. Dev Cell. .

Abstract

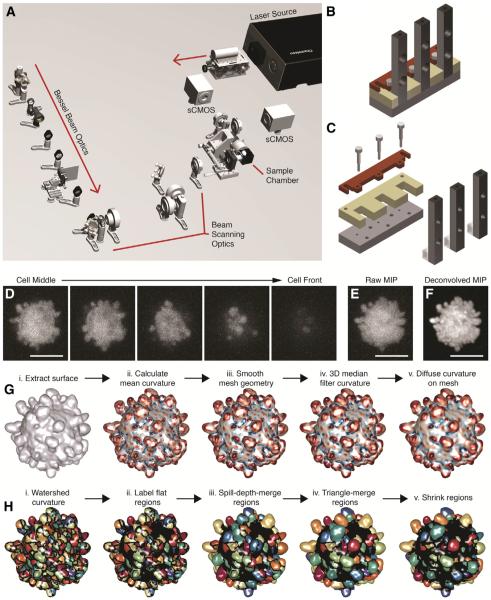
The microenvironment determines cell behavior, but the underlying molecular mechanisms are poorly understood because quantitative studies of cell signaling and behavior have been challenging due to insufficient spatial and/or temporal resolution and limitations on microenvironmental control. Here we introduce microenvironmental selective plane illumination microscopy (meSPIM) for imaging and quantification of intracellular signaling and submicrometer cellular structures as well as large-scale cell morphological and environmental features. We demonstrate the utility of this approach by showing that the mechanical properties of the microenvironment regulate the transition of melanoma cells from actin-driven protrusion to blebbing, and we present tools to quantify how cells manipulate individual collagen fibers. We leverage the nearly isotropic resolution of meSPIM to quantify the local concentration of actin and phosphatidylinositol 3-kinase signaling on the surfaces of cells deep within 3D collagen matrices and track the many small membrane protrusions that appear in these more physiologically relevant environments.


Figures

Figure 1
Figure 1. meSPIM Design Enables High-Resolution Imaging over Large Volumes in Controlled Microenvironments
(A and B) Simulation of the excitation confinement (A; percentage of excitation intensity contained within the depth of focus of the detection objective [1.1 μm] relative to total excitation intensity of a light sheet; squared intensity values are applied for two-photon excitation) for one-photon Bessel beam LSFM (Planchon et al., 2011), two photon Bessel beam LSFM (Planchon et al., 2011), and hexagonal lattice LSFM (Chen et al., 2014) for a beam propagation length of 100 μm and (B) the corresponding axial intensity profiles. (C) Operating principle of the meSPIM normal mode: a Bessel beam (solid red) is rapidly scanned laterally to synthesize a time-averaged sheet of light (light red), and all camera pixels are exposed simultaneously (bottom, light gray). (D) Operating principle of the meSPIM descanned mode: only a subset of pixels encompassing the image of the main lobe of the Bessel beam are active (bottom, light gray). This region is scanned synchronously with the Bessel beam to form a 2D image. (E–G) Axial cross-sections of the raw image volume, i.e. no deconvolution, of a 100 nm bead in the normal (E) and descanned (F) mode along with corresponding axial profiles (G). Image data are resampled (33) by zero padding of the Fourier transform of the bead images. Scale bars, 0.5 μm (H) Axial sectioning of a human bronchial epithelial cell (HBEC) spheroid expressing eGFP-KrasV12 in the normal and descanned modes. (I) Stationary two-photon Bessel beam as imaged in an aqueous fluorescein solution. Scale bar, 10 μm. (J) xz cross-section, obtained by summing two adjacent image slices, of collagen labeled with CNA35 peptide conjugated to Cy5 dye imaged in normal mode. Scale bar, 10 μm. (K) Measurement of meSPIM resolution in the axial and lateral dimensions, given as the FWHM of 200-nm fluorescent beads. See also Figure S1. (L) Rendering of the microscope sample holder and objective geometry. (M) Detailed rendering of the sample holder consisting of an aluminum beam (black) and an agarose cube (light gray) that contains the collagen sample (green). (N) Non-deconvolved xy maximum intensity projection over the entire cellular volume of a primary melanoma cell expressing GFP-tractin embedded in collagen near a glass coverslip and imaged using a spinning disk confocal microscope. (O) Non-deconvolved xy maximum intensity projection over the entire cellular volume of two primary melanoma cells expressing GFP-tractin and from the same tumor as the cell in (M). (P) Non-deconvolved xy maximum intensity projection over the entire cellular volume of a primary melanoma cell expressing GFP-tractin embedded in collagen crosslinked with 3 mM ribose. The cells in (O) and (P) are embedded in 2.0 mg/ml collagen far from any hard surfaces and were imaged using meSPIM in non-descanned mode. Scale bars, 10 μm (N, O, and P).
Figure 2
Figure 2. meSPIM Enables Imaging of Fine, Subcellular Features over Large Image Volumes
(A) 3D volume rendering of a single melanoma cell in a cubic volume measuring 100 μm on each side (Movie S1). The cell is labeled with cytosolic GFP and the collagen I matrix was labeled with CNA35 conjugated to Cy5. Neither the GFP nor the collagen channel are deconvolved. (B) xy maximum intensity projections of MV3 cells over 3 μm about the equatorial plane. (C) Deconvolved images of transformed HBEC expressing GFP-tractin in a collagen I matrix. (i) Cross-sectional views in the xy and xz planes are obtained via maximum intensity projections over 2 μm about the equatorial plane. (ii) Maximum intensity projections over the entire image volume of the same cell (Movie S1). (iii) Magnified view of the boxed region in (ii). (D) 3D volume rendering of transformed HBEC cells expressing eGFP-KrasV12; image volume acquired in descanned mode (Movie S1). (E) Non-descanned, non-deconvolved xz crosssection obtained by summing two adjacent slices. (F) Descanned, non-deconvolved xz cross-section obtained by summing two adjacent slices. Scale bars, 10 μm.
Figure 3
Figure 3. meSPIM Combined with Computer Vision Enables Imaging, Visualization, and Quantification of How Cells Alter Collagen Fibers over Large Distances within an Image Volume Measuring 100 μm on Each Side
(A) xy maximum intensity projections over 12 μm showing single collagen fibers labeled with CNA35 peptide conjugated to Cy5 dye imaged in normal mode (top), output of the steerable filter algorithm showing the filter response (middle), and central locations (non-maximum suppressed) of collagen fibers (bottom) (Movie S2). (B) 3D volume rendering of two melanoma cells (red) and the central locations of collagen fibers (grayscale). (C–E) Normalized fiber density (averaged over 2 μm) surrounding the single MV3 cell in Figure 2A shown as a 3D rendering of the xy view over the minimum axial distance necessary to encompass the cell (C; Movie S2). Fiber alignment relative to the vector pointing toward the cell center, shown as (D) xy and (E) xz maximum intensity projection over 12 μm. (F) Mean fiber density over the entire image volume as a function of distance from the cell edge. (G) Nematic order parameter as a measure of fiber alignment toward the cell center. A value of 1 indicates perfect alignment toward the cell center and 0 indicates random alignment. Scale bars, 10 μm.
Figure 4
Figure 4. meSPIM Enables Detailed Imaging of the Morphological Diversity of Melanoma Cells in Mechanically Unperturbed 3D Microenvironments
(A) Maximum intensity projection of an MV3 cell expressing GFP-tractin. Green arrowheads indicate actin-rich filopodia and yellow arrowheads indicate non-apoptotic membrane blebs. (B) 3D volume rendering of an MV3 cell expressing CyOFP-tractin and cytosolic GFP. Emergence of an actin-free membrane bleb and ensuing accumulation of actin in the newly formed membrane protrusion are indicated by arrowheads (Movie S3). (C) A 3D volume rendering of a rapid protrusion event in a primary melanoma cell expressing cytosolic GFP (Movie S3). (D) A 3D volume rendering of stable protrusive structures and sustained blebbing in a primary melanoma cell expressing cytosolic GFP (Movie S3). (E) xy maximum intensity projections (over the entire image volume) of primary melanoma cells expressing GFP-tractin (Movie S3). Arrowheads indicate the emergence of new blebs. The first time point of this time lapse acquisition is shown in Figure 1O. (F) xy maximum intensity projection over the entire image volume along with xy and xz cross-sections of an MV3 cell expressing a membrane marker consisting of td-Tomato fused to the first 60 base pairs of GAP43 (Figure S4). Arrowheads indicate local enrichment of the plasma membrane. Scale bars, 10 μm.
Figure 5
Figure 5. meSPIM Combined with Computer Vision Enables the Automated Detection and Tracking of Dynamic 3D Morphological Structures Vision Enables the Automated Detection and Tracking of Dynamic 3D Morphological Structures
(A) xy maximum intensity projection (over the entire image volume) of a primary melanoma cell expressing cytosolic GFP. (B) Surface curvature of the cell shown in (A). Inset shows the triangularized mesh that represents the cell surface. (C) High-curvature surface structures (blebs) identified by segmentation and region merging (Movie S4). (D) Frequency distributions of bleb surface areas on six different cells (see also Figure S5). Inset: maximum intensity projections of cells corresponding to the color-matched frequency distributions. (E) 3D surface renderings of mean curvature from a rapid time lapse series (1.2 s per image volume). (F) Automated tracking of individual blebs; colors indicate separate tracks (Movie S4). (G) Close-up of the region indicated in (E), showing the entire lifecycle of a single membrane bleb. (H) Close-up of the region indicated in (F), showing individually tracked blebs encoded by color. Scale bar, 10 μm.
Figure 6
Figure 6. Nearly Isotropic Resolution of meSPIM Enables Quantification of Protein Intensity on the Cell Surface
(A–C) Intensity measured on the surface of a simulated, uniformly cytosolically labeled cell imaged with (A) isotropic resolution, (B) worse isotropic resolution, (C) and asymmetric resolution with axial resolution as in (B) and lateral resolution as in (A). Note that surface intensity in (A)–(C) all share the same color map, shown on the far right. (D) Maximum intensity projections of two HBEC cells expressing GFP-tractin. Because of the high dynamic range, both images were gamma corrected with a gamma of 0.6. (E and F) The surfaces of these two cells are shown colored by the local concentration of actin within a 1-μm radius. (G) Maximum intensity projections at two time points of a melanoma cell (MV3) embedded in crosslinked collagen and expressing GFP-AktPH, a PI3K activity biosensor. (H and I) The surfaces at these two times are shown colored by the local concentration of AktPH within a 1-μm radius. Scale bars, 10 μm.
Figure 7
Figure 7. meSPIM Design and Bleb Segmentation Workflow
(A) Detailed rendering of the meSPIM optical train (its components are described in detail in the microscope components folder within the meSPim Supplemental Information zip file). (B and C) Mold for casting the agarose sample holder and sample mounting apparatus. (D–H) Bleb segmentation workflow. (D) xy maximum intensity projections of the undeconvolved image over consecutive depths of 2 μm from the middle to the front of the cell. (E) xy maximum intensity projection over the entire cell. (F) xy maximum intensity projection over the entire cell of the deconvolved image. (G, i) The cell surface is extracted from the deconvolved image. (ii, iii) The mesh that represents the cell surface is smoothed and the mean surface curvature calculated. (iv) Curvature is median filtered in 3D and (v) then further smoothed by allowing it to diffuse over the surface. (H, i) To segment blebs, smoothed curvature is next segmented using a watershed algorithm, and (ii) flat regions, shown black, are labeled. (iii) Regions are next iteratively merged using a spilldepth criterion and then (iv) iteratively merged using a triangle criterion. (v) Finally, regions can be shrunk for visualization. Scale bars, 10 μm.

References

    1. Aguet F, Jacob M, Unser M. Three-dimensional feature detection using optimal steerable filters. Proceedings of the 2005 International Conference on Image Processing (ICIP); Proceedings of the 2005 International Conference on Image Processing (ICIP) (IEEE).2005. pp. 1158–1161.
    1. Ahrens MB, Orger MB, Robson DN, Li JM, Keller PJ. Whole-brain functional imaging at cellular resolution using light-sheet microscopy. Nat. Methods. 2013;10:413–420. - PubMed
    1. Baumgart E, Kubitscheck U. Scanned light sheet microscopy with confocal slit detection. Opt. Express. 2012;20:21805–21814. - PubMed
    1. Blaser H, Reichman-Fried M, Castanon I, Dumstrei K, Marlow FL, Kawakami K, Solnica-Krezel L, Heisenberg C-P, Raz E. Migration of zebrafish primordial germ cells: a role for myosin contraction and cytoplasmic flow. Dev. Cell. 2006;11:613–627. - PubMed
    1. Brownfield DG, Venugopalan G, Lo A, Mori H, Tanner K, Fletcher DA, Bissell MJ. Patterned collagen fibers orient branching mammary epithelium through distinct signaling modules. Curr. Biol. 2013;23:703–709. - PMC - PubMed

Publication types