. 2016 Jun 10;24(17):1013-28.
doi: 10.1089/ars.2015.6501. Epub 2016 Mar 30.

Carbon Monoxide Gas Is Not Inert, but Global, in Its Consequences for Bacterial Gene Expression, Iron Acquisition, and Antibiotic Resistance

Affiliations

Carbon Monoxide Gas Is Not Inert, but Global, in Its Consequences for Bacterial Gene Expression, Iron Acquisition, and Antibiotic Resistance

Lauren K Wareham et al. Antioxid Redox Signal. .

Abstract

Aims: Carbon monoxide is a respiratory poison and gaseous signaling molecule. Although CO-releasing molecules (CORMs) deliver CO with temporal and spatial specificity in mammals, and are proven antimicrobial agents, we do not understand the modes of CO toxicity. Our aim was to explore the impact of CO gas per se, without intervention of CORMs, on bacterial physiology and gene expression.

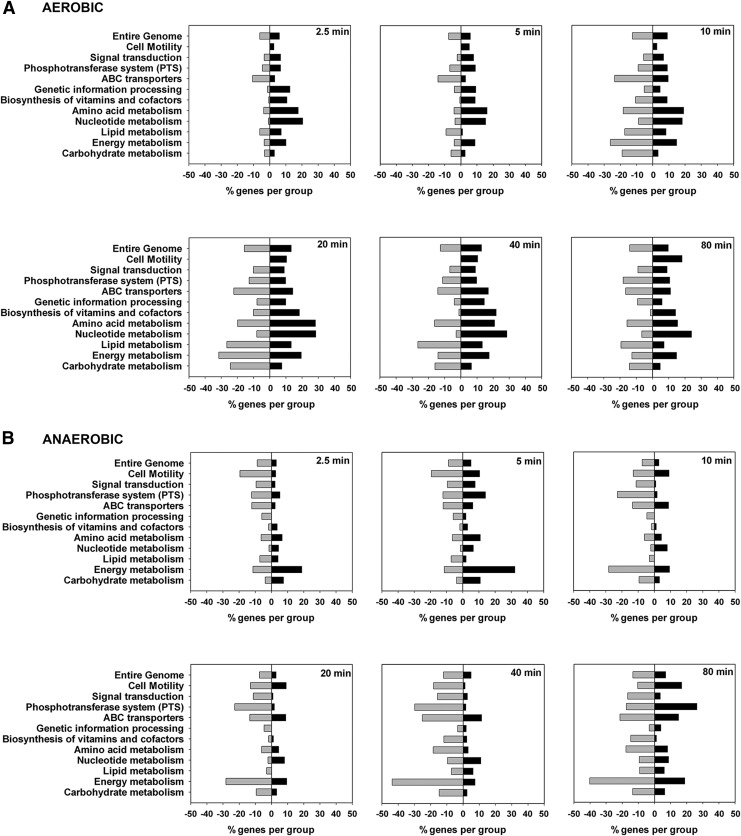
Results: We used tightly controlled chemostat conditions and integrated transcriptomic datasets with statistical modeling to reveal the global effects of CO. CO is known to inhibit bacterial respiration, and we found expression of genes encoding energy-transducing pathways to be significantly affected via the global regulators, Fnr, Arc, and PdhR. Aerobically, ArcA-the response regulator-is transiently phosphorylated and pyruvate accumulates, mimicking anaerobiosis. Genes implicated in iron acquisition, and the metabolism of sulfur amino acids and arginine, are all perturbed. The global iron-related changes, confirmed by modulation of activity of the transcription factor Fur, may underlie enhanced siderophore excretion, diminished intracellular iron pools, and the sensitivity of CO-challenged bacteria to metal chelators. Although CO gas (unlike H2S and NO) offers little protection from antibiotics, a ruthenium CORM is a potent adjuvant of antibiotic activity.

Innovation: This is the first detailed exploration of global bacterial responses to CO, revealing unexpected targets with implications for employing CORMs therapeutically.

Conclusion: This work reveals the complexity of bacterial responses to CO and provides a basis for understanding the impacts of CO from CORMs, heme oxygenase activity, or environmental sources. Antioxid. Redox Signal. 24, 1013-1028.


Figures

<b>FIG. 1.</b>
FIG. 1.
Functional categories of genes affected by CO gas addition in aerobic and anaerobic conditions. Transcriptomic analyses were performed at 2.5, 5, 10, 20, 40, and 80 min after the flow of CO gas was initiated in both aerobic (A) and anaerobic (B) conditions as described in the Materials and Methods section. Genes are grouped according to functional categories. The percentages of genes in each panel that showed elevated expression (black bars, right) or reduced expression (gray bars, left) are shown.
<b>FIG. 2.</b>
FIG. 2.
CO-induced transcriptomic changes of genes involved in the TCA (Krebs) cycle, glycolytic pathways, and O2-dependent electron transport pathways in aerobic and anaerobic conditions. (A) The major routes of carbon flow through the Embden–Meyerhof pathway and Krebs cycle are shown. (B) Reducing equivalents from NADH are fed via two NADH dehydrogenases (Ndh, Nuo) to a quinone pool (Q) and thence to one of three terminal oxidases (cytochromes bd-I, bd-II, and bo′). Each block of color strips indicates a single gene involved in the reaction step shown and, within each block, the vertical strips show (from left to right) changes in gene expression at the sampling points (2.5, 5, 10, 20, 40, and 80 min after introducing CO gas). Changes in gene expression are illustrated by the heat map (right): blue color indicates a gene that is downregulated, red color indicates upregulation, and yellow color indicates no change in transcriptomic level. TCA, tricarboxylic acid. To see this illustration in color, the reader is referred to the web version of this article at www.liebertpub.com/ars
<b>FIG. 3.</b>
FIG. 3.
TFInfer correlation profile of TF activities in CO aerobic conditions versus anoxic conditions. Profile differences are plotted on the abscissa and differences in magnitude on the ordinate. In quadrants (A, C, D), the dynamics of one representative TF are shown both aerobically and anaerobically. For example, the response profiles for the TFs, FNR and CysB, are similar in both conditions, in both the magnitude of the response and their correlation (appearing in the lower left quadrant), while GadX and PdhR (upper left) have a similar response in terms of the shape of the profile, while the magnitude of the response is greater in anaerobic conditions than aerobic conditions. On the other hand, the response of the TF MetJ is different both in magnitude and in the shape of the profile, lying near the interface of the upper and lower right quadrants. ArgR and HNS have a similar response in terms of the magnitude of the profile, while the shape of the activity curve of the response is greater in aerobic conditions than anaerobic conditions. Absolute Pearson correlations in the middle indicate only weak similarity between profiles. FNR, fumarate nitrate reduction regulator; TF, transcription factor.
<b>FIG. 4.</b>
FIG. 4.
Inferred activity of the TFs, ArcA, FNR, and PdhR, in response to CO. Response profiles for ArcA (top, circles), FNR (middle, squares), and PdhR (bottom, triangles) are shown as predicted by TFInfer. TF activity is plotted for each time point using TFInfer data modeled on gene changes in response to CO at each time point. Aerobic profiles are shown with closed symbols (left) and anoxic profiles with open symbols (right).
<b>FIG. 5.</b>
FIG. 5.
The phosphorylation state of ArcA in the absence and presence of CO and corresponding pyruvate levels in cells. (A, B) Typical Western blots developed using ArcA polyclonal antiserum for Phos-tag™ gels and cultures grown with/without CO at the time points shown, both aerobically and anaerobically. Controls with purified ArcA are shown: the lane labeled “+” shows ArcA-P (25 ng purified ArcA phosphorylated in vitro using carbamoyl phosphate), and the lane labeled “−” shows 25 ng unphosphorylated ArcA. (C) The percentage of Arc-P in each sample was calculated from band intensities; results show ArcA-P expressed as a percentage of total ArcA/ArcA-P in each sample.(D) Pyruvate levels were assayed in culture supernatants collected over time (in each condition: solid bars, t = 0; hashed bars, t = 5; spotted bars, t = 20; checkered bars, t = 80).
<b>FIG. 6.</b>
FIG. 6.
Predicted TF activity of Fur, a transcriptional repressor of Fe-regulated genes, and corresponding gene changes. TFInfer data over time for Fur are shown under (A) aerobic and (B) anaerobic conditions in the presence of CO. (C) and (D) map changes in iron-regulated genes aerobically and anaerobically, respectively. Yellow indicates genes that remain unchanged in the presence of CO, red indicates genes upregulated, and blue indicates genes downregulated, according to the heat map (right). The intensity of the color is indicative of the trust placed on that measured level of regulation after three biological repeats. Feature extraction from the scanned arrays and subsequent data analysis used GeneSpring GX v7.3. The clustering at the left is a GeneSpring gene tree and shows genes organized by their similarity in response to the imposed conditions. To see this illustration in color, the reader is referred to the web version of this article at www.liebertpub.com/ars
<b>FIG. 7.</b>
FIG. 7.
Cells exposed to CO produce higher levels of siderophores as free intracellular iron pools are depleted. Stationary Escherichia coli cultures were grown and 10 μl aliquots of culture were spotted onto 25-ml CAS agar plates. Cells were incubated in aerobic (air)/aerobic + CO (air +50% CO) or anaerobic (N2)/anaerobic + CO (N2/50% CO) conditions for 24 h. The diameter of the cells plus halo and the diameter of the cells alone were measured and the difference plotted in (A). The presence of CO increased siderophore production in aerobic and anaerobic conditions; results are plotted as mean ± SD of two biological repeats each with four technical replicates. A paired t-test shows *p of 0.03 and **p of 0.008. (B) The ferric iron in rhombic coordination in whole cells as measured by electron paramagnetic resonance (EPR) spectroscopy shows that the iron levels decreased both aerobically and anaerobically on exposure to CO gas. Results are plotted as mean ± SD of two biological repeats each with two technical replicates. A paired t-test shows *p of 0.05 and **p of 0.005. CAS, Chrome Azurol S.
<b>FIG. 8.</b>
FIG. 8.
Effects of CO gas on bacterial sensitivity to metal chelators and antibiotics. Aliquots of E. coli in defined medium were dispensed into the wells of a 96-well plate and supplemented with the following compounds at the concentrations shown: (A) 8-hydroxyquinoline, (B) citric acid, (C) the antibiotics doxycycline (DC), trimethoprim (TR), and cefotaxime (CT). Percentage inhibition was calculated as 100 − (X/Y × 100), where X denotes growth observed in a CO atmosphere (25% CO +75% air or 25% CO +75% N2) and Y the observed growth in the equivalent atmosphere without CO. Data are representative of two biological repeats and each of four technical repeats, expressed as mean ± SD. *p < 0.05, **p < 0.01, ***p < 0.001 (Paired t-test).
<b>FIG. 9.</b>
FIG. 9.
Schematic diagram of the global impacts of CO gas on E. coli. Inhibition of the electron transfer chain results in stimuli that cause ArcA phosphorylation, namely over-reduction of the quinone pool and formation of the fermentation product, pyruvate, in concentrations that can be assayed extracellularly. Transcriptomic responses are consistent with direct or indirect modulation by CO of Fnr and Fur activities.

Similar articles

Cited by

References

    1. Adrait A, Jacquamet L, LePape L, dePeredo AG, Aberdam D, Hazemann JL, Latour JM, and Michaud-Soret I. Spectroscopic and saturation magnetization properties of the manganese- and cobalt-substituted Fur (Ferric uptake regulation) protein from Escherichia coli. Biochemistry 38: 6248–6260, 1999 - PubMed
    1. Alvarez AF. and Georgellis D. In vitro and in vivo analysis of the ArcB/A redox signaling pathway. Methods Enzymol 471: 205–228, 2010 - PubMed
    1. Ashcroft JR. and Haddock BA. Synthesis of alternative membrane-bound redox carriers during aerobic growth of Escherichia coli in the presence of cyanide. Biochem J 148: 349–352, 1975 - PMC - PubMed
    1. Asif HM, Rolfe MD, Green J, Lawrence ND, Rattray M, and Sanguinetti G. TFInfer: a tool for probabilistic inference of transcription factor activities. Bioinformatics 26: 2635–2636, 2010 - PubMed
    1. Augustus AM. and Spicer LD. The MetJ regulon in gammaproteobacteria determined by comparative genomics methods. BMC Genomics 12: 558, 2011 - PMC - PubMed

MeSH terms

LinkOut - more resources