

Confidence through consensus: a neural mechanism for uncertainty monitoring
- PMID: 26907162
- PMCID: PMC4764837
- DOI: 10.1038/srep21830
Confidence through consensus: a neural mechanism for uncertainty monitoring
Abstract
Models that integrate sensory evidence to a threshold can explain task accuracy, response times and confidence, yet it is still unclear how confidence is encoded in the brain. Classic models assume that confidence is encoded in some form of balance between the evidence integrated in favor and against the selected option. However, recent experiments that measure the sensory evidence's influence on choice and confidence contradict these classic models. We propose that the decision is taken by many loosely coupled modules each of which represent a stochastic sample of the sensory evidence integral. Confidence is then encoded in the dispersion between modules. We show that our proposal can account for the well established relations between confidence, and stimuli discriminability and reaction times, as well as the fluctuations influence on choice and confidence.
Figures
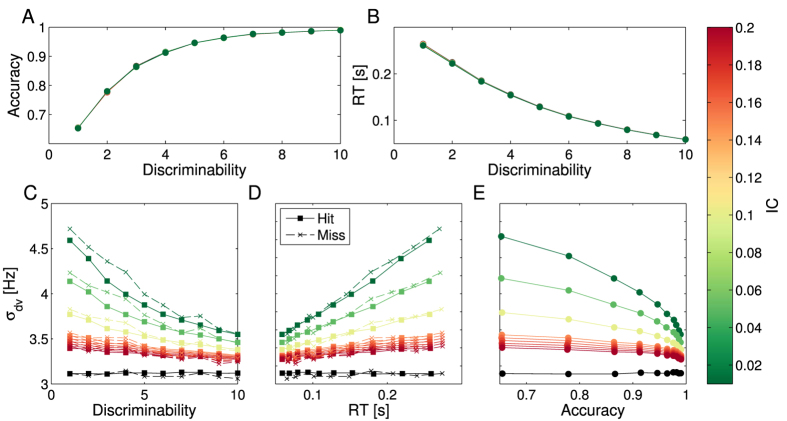
 . It is clear that different IC values do not affect the relation between these variables. (C–E) show the average σdv for different IC values as a function of discriminability, average RT and average accuracy. In (C,D), square markers indicate averaged values over correct trials and crosses correspond to averaged values over incorrect trials. It is clear that σdv is correlated with discriminability, RT and accuracy for low IC values, and the correlation vanishes for high IC’s. It is also clear that for low discriminabilities, σdv is on average higher, hence confidence will be lower. In C, it is clear that error trials have higher average σdv for all discriminabilities, and thus will be associated with lower confidence reports. However, σdv’s increase in error trials does not affect the functional relation between σdv and RT, as is clear from (D).
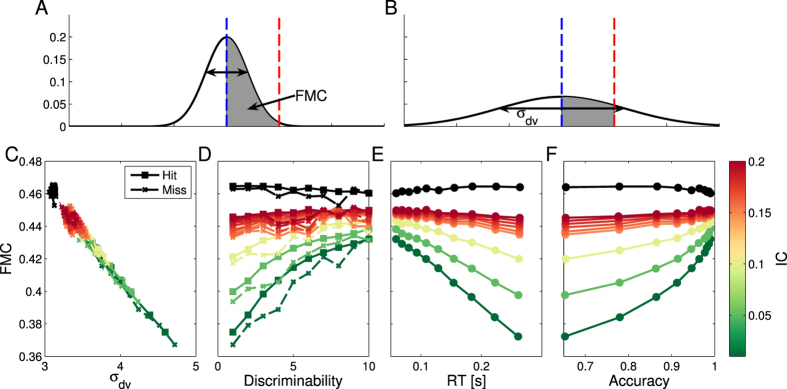
 . When an option is selected, the median firing rate is equal to λ and the FMC is inversely related to σdv. (C) measures the relation between average σdv and average FMC for different discriminabilities and several IC values. The different IC values are represented with different colors as shown in the lateral color bar. The black data points are for
  . (D–F) show FMC as a function of stimuli discriminability, average RT and accuracy. It is clear that average FMC is inversely correlated to σdv, hence for small IC’s FMC is correlated with discriminability, RT and accuracy. However, the inverse relation with σdv associates large FMC to high confidence and small FMC to low confidence.
References
-
- Usher M. & McClelland J. L. The time course of perceptual choice: The leaky, competing accumulator model. Psychological Review 108, 550–592 (2001). - PubMed
-
- Smith P. L. & Ratcliff R. Psychology and neurobiology of simple decisions. Trends in Neurosciences 27, 161–168 (2004). - PubMed
-
- Bogacz R., Brown E., Moehlis J., Holmes P. & Cohen J. D. The physics of optimal decision making: a formal analysis of models of performance in two-alternative forced-choice tasks. Psychological review 113, 700–65 (2006). - PubMed
-
- Brown S. D. & Heathcote A. The simplest complete model of choice response time: Linear ballistic accumulation. Cognitive Psychology 57, 153–178 (2008). - PubMed
-
- Smith P. L. & McKenzie C. R. L. Diffusive information accumulation by minimal recurrent neural models of decision making. Neural computation 23, 2000–2031 (2011). - PubMed
Publication types
MeSH terms
LinkOut - more resources
Full Text Sources
Other Literature Sources
