. 2016 Feb 19;16(2):241.
doi: 10.3390/s16020241.

Hybrid EEG--Eye Tracker: Automatic Identification and Removal of Eye Movement and Blink Artifacts from Electroencephalographic Signal

Affiliations

Hybrid EEG--Eye Tracker: Automatic Identification and Removal of Eye Movement and Blink Artifacts from Electroencephalographic Signal

Malik M Naeem Mannan et al. Sensors (Basel). .

Abstract

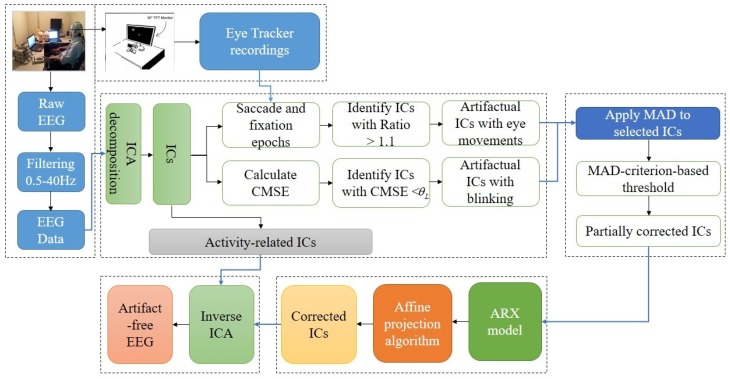
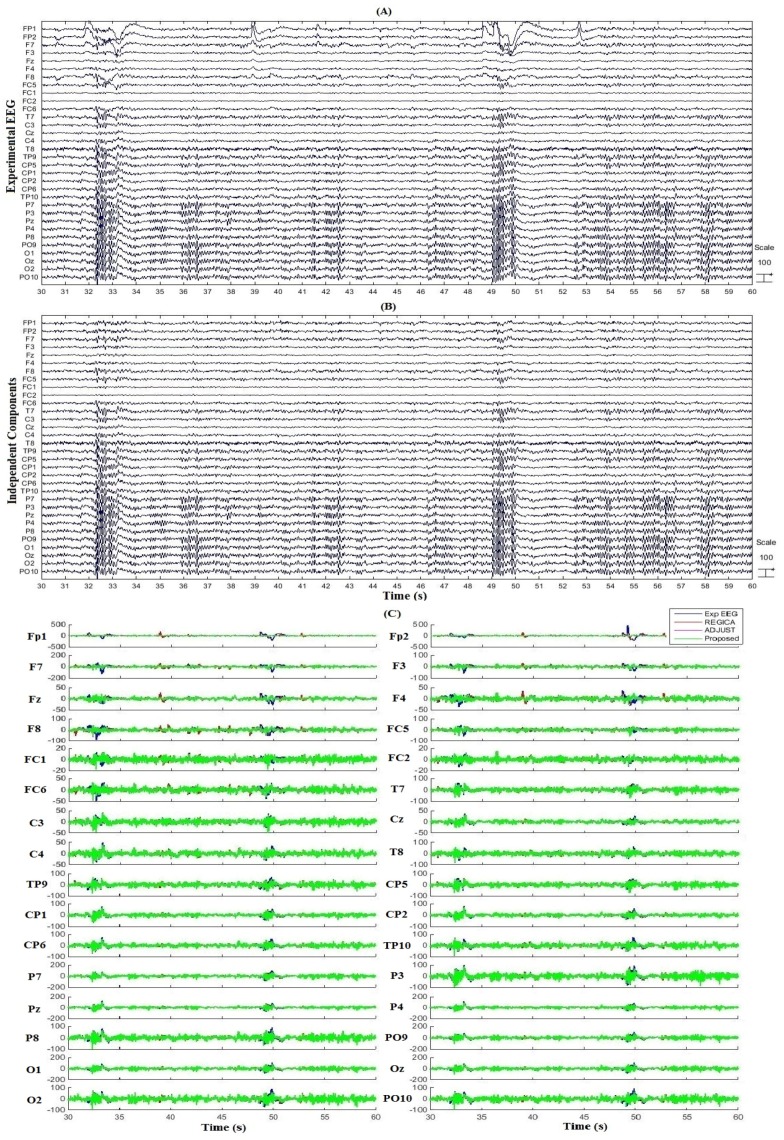
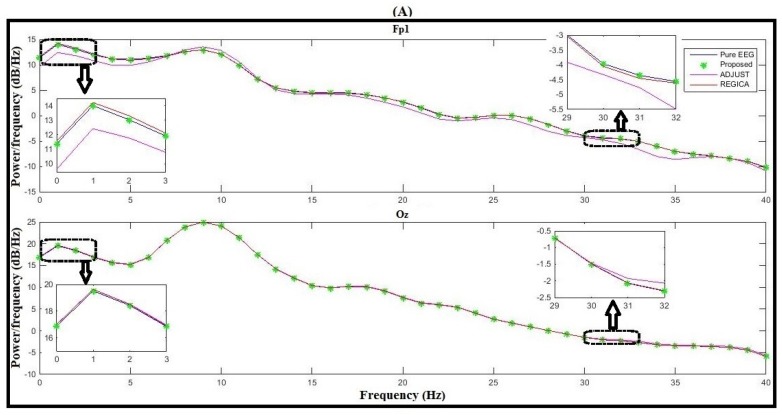
Contamination of eye movement and blink artifacts in Electroencephalogram (EEG) recording makes the analysis of EEG data more difficult and could result in mislead findings. Efficient removal of these artifacts from EEG data is an essential step in improving classification accuracy to develop the brain-computer interface (BCI). In this paper, we proposed an automatic framework based on independent component analysis (ICA) and system identification to identify and remove ocular artifacts from EEG data by using hybrid EEG and eye tracker system. The performance of the proposed algorithm is illustrated using experimental and standard EEG datasets. The proposed algorithm not only removes the ocular artifacts from artifactual zone but also preserves the neuronal activity related EEG signals in non-artifactual zone. The comparison with the two state-of-the-art techniques namely ADJUST based ICA and REGICA reveals the significant improved performance of the proposed algorithm for removing eye movement and blink artifacts from EEG data. Additionally, results demonstrate that the proposed algorithm can achieve lower relative error and higher mutual information values between corrected EEG and artifact-free EEG data.

Keywords: affine projection algorithm; auto-regressive exogenous model; composite multi-scale entropy; electroencephalogram; eye tracker; independent component analysis; median absolute deviation; ocular artifacts.


Figures

Figure 1
Figure 1
Schematic diagrams. (A) Regression method; (B) Independent component analysis.
Figure 2
Figure 2
Schematic diagram of the proposed algorithm.
Figure 3
Figure 3
(A) Electroencephalogram (EEG) electrode configuration; (B) Distribution of saccade amplitude.
Figure 4
Figure 4
Results on experimental dataset. (A) Experimental EEG data for one subject; (B) Independent components (ICs) obtained from independent component analysis (ICA) decomposition of EEG data; (C) Comparison of the corrected EEG by the proposed algorithm and conventional algorithms.
Figure 5
Figure 5
Comparison of the proposed algorithm with ADJUST using experimental data. (A) Contaminated experimental EEG data at Fp1 and Fp2; (B) Corrected EEG by the proposed algorithm; (C) Corrected EEG by ADJUST; (D) Comparison of corrected EEG with contaminated experimental EEG. (E) Partial enlargement of highlighted regions.
Figure 6
Figure 6
Comparison of the proposed algorithm with REGICA using experimental data. (A) Contaminated experimental EEG data at Fp1 and Fp2; (B) Corrected EEG by the proposed algorithm; (C) Corrected EEG by REGICA; (D) Comparison of corrected EEG with contaminated experimental EEG; (E) Partial enlargement of highlighted regions.
Figure 7
Figure 7
Comparison results of the proposed algorithm and ADJUST for all subjects at Fp1 and Fp2.
Figure 8
Figure 8
Comparison results of the proposed algorithm and REGICA for all subjects at Fp1 and Fp2.
Figure 9
Figure 9
Comparison of the proposed algorithm with ADJUST and REGICA in frequency domain at Fp1 and Oz. (A) EEG spectra after applying filter 0.5–40 Hz; (B) EEG spectra after applying filter 0.5–20 Hz.
Figure 9
Figure 9
Comparison of the proposed algorithm with ADJUST and REGICA in frequency domain at Fp1 and Oz. (A) EEG spectra after applying filter 0.5–40 Hz; (B) EEG spectra after applying filter 0.5–20 Hz.
Figure 10
Figure 10
Comparison of the proposed algorithm with ADJUST using standard data. (A) Contaminated experimental EEG data at Fp1 and Fp2. (B) Corrected EEG by the proposed algorithm. (C) Corrected EEG by ADJUST. (D) Comparison of Corrected EEG with contaminated experimental EEG. (E) Partial enlargement of highlighted regions.

Similar articles

Cited by

References

    1. Jöbsis F.F. Noninvasive infrared monitoring of cerebral and myocardial oxygen sufficiency and circulatory parameters. Science. 1977;198:1264–1267. doi: 10.1126/science.929199. - DOI - PubMed
    1. Friston K.J., Jezzard P., Turner R. Analysis of functional MRI time-series. Hum. Brain Mapp. 1994;1:153–171. doi: 10.1002/hbm.460010207. - DOI
    1. Hogervorst M.A., Brouwer A.-M., van Erp J.B.F. Combining and comparing EEG, peripheral physiology and eye-related measures for the assessment of mental work load. Front. Neurosci. 2014;8 doi: 10.3389/fnins.2014.00322. - DOI - PMC - PubMed
    1. Kamran M.A., Hong K.-S., Mannan M.N.M. Identification of fNIRS based Brain Activity Using Adaptive Algorithm. NUST J. Eng. Sci. 2012;5:7–10.
    1. Kamran M.A., Jeong M.Y., Mannan M.N.M. Optimal hemodynamic response model for functional near-infrared spectroscopy. Front. Behav. Neurosci. 2015;9 doi: 10.3389/fnbeh.2015.00151. - DOI - PMC - PubMed

Publication types

LinkOut - more resources