

Burden of Infected Diabetic Foot Ulcers on Hospital Admissions and Costs
- PMID: 26907372
- PMCID: PMC6048950
- DOI: 10.1016/j.avsg.2015.11.025
Burden of Infected Diabetic Foot Ulcers on Hospital Admissions and Costs
Abstract
Background: Costs related to diabetic foot ulcer (DFU) care are greater than $1 billion annually and rising. We sought to describe the impact of diabetes mellitus (DM) on foot ulcer admissions in the United States, and to investigate potential explanations for rising hospital costs.
Methods: The Nationwide Inpatient Sample (2005-2010) was queried using International Classification of Diseases, 9th Revision (ICD-9) codes for a primary diagnosis of foot ulceration. Multivariable analyses were used to compare outcomes and per-admission costs among patients with foot ulceration and DM versus non-DM.
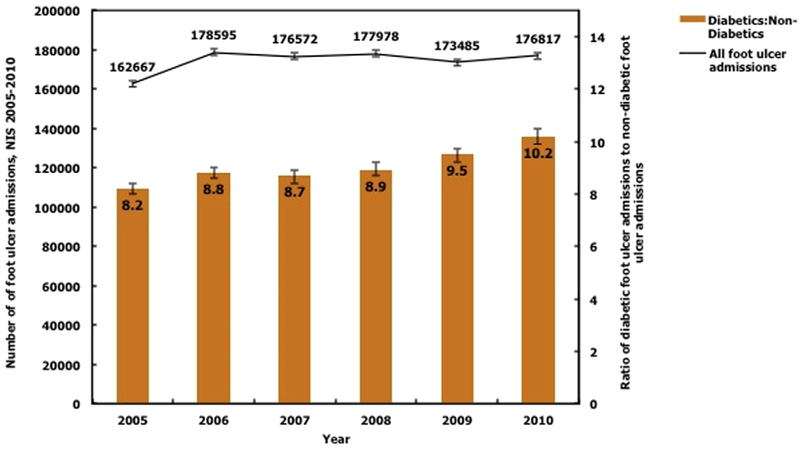
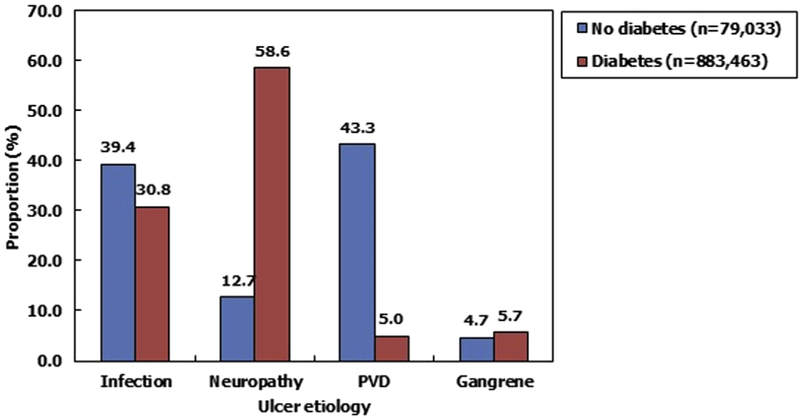
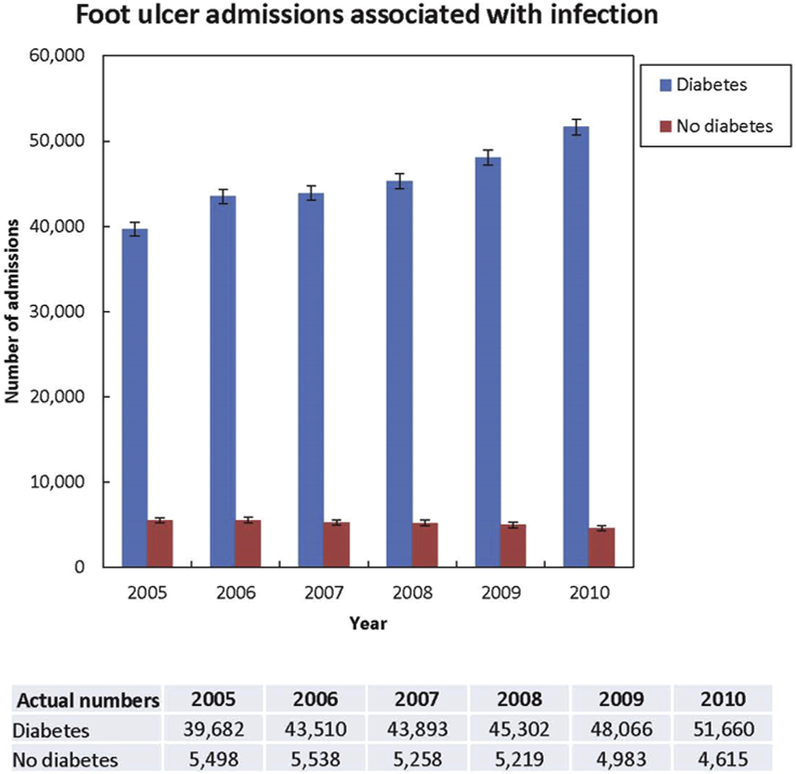
Results: In total, 962,496 foot ulcer patients were admitted over the study period. The overall rate of admissions was relatively stable over time, but the ratio of DM versus non-DM admissions increased significantly (2005: 10.2 vs. 2010: 12.7; P < 0.001). Neuropathy and infection accounted for 90% of DFU admissions, while peripheral vascular disease accounted for most non-DM admissions. Admissions related to infection rose significantly among DM patients (2005: 39,682 vs. 2010: 51,660; P < 0.001), but remained stable among non-DM patients. Overall, DM accounted for 83% and 96% of all major and minor amputations related to foot ulcers, respectively, and significantly increased cost of care (DM: $1.38 vs. non-DM: $0.13 billion/year; P < 0.001). Hospital costs per DFU admission were significantly higher for patients with infection compared with all other causes ($11,290 vs. $8,145; P < 0.001).
Conclusions: Diabetes increases the incidence of foot ulcer admissions by 11-fold, accounting for more than 80% of all amputations and increasing hospital costs more than 10-fold over the 5 years. The majority of these costs are related to the treatment of infected foot ulcers. Education initiatives and early prevention strategies through outpatient multidisciplinary care targeted at high-risk populations are essential to preventing further increases in what is already a substantial economic burden.
Copyright © 2016 Elsevier Inc. All rights reserved.
Figures
References
-
- Centers for Disease Control and Prevention (CDC). Number (in Thousands) of Hospital Discharges with Diabetes as Any-Listed Diagnosis, United States, 1988–2009. Available at: http://www.cdc.gov/diabetes/statistics/dmany/fig1.htm; 2009. Accessed 12 February, 2014.
-
- Centers for Disease Control and Prevention (CDC). National Diabetes Statistic Report, 2014. Available at: http://www.cdc.gov/diabetes/pubs/statsreport14/national-diabetes-report-...; 2014. Accessed 12 February, 2014.
-
- Driver VR, Fabbi M, Lavery LA, et al. The costs of diabetic foot: the economic case for the limb salvage team. J Vasc Surg 2010;52:17S–22S. - PubMed
-
- Harrington C, Zagari MJ, Corea J, et al. A cost analysis of diabetic lower-extremity ulcers. Diabetes Care 2000;23: 1333–8. - PubMed
-
- American Diabetes Association. Economic costs of diabetes in the U.S. In 2007. Diabetes Care 2008;31:596–615. - PubMed
Publication types
MeSH terms
Grants and funding
LinkOut - more resources
Full Text Sources
Other Literature Sources
Medical
