Fetal-maternal nitrite exchange in sheep: Experimental data, a computational model and an estimate of placental nitrite permeability
- PMID: 26907384
- PMCID: PMC4768312
- DOI: 10.1016/j.placenta.2015.12.009
Fetal-maternal nitrite exchange in sheep: Experimental data, a computational model and an estimate of placental nitrite permeability
Abstract
Introduction: Nitrite conveys NO-bioactivity that may contribute to the high-flow, low-resistance character of the fetal circulation. Fetal blood nitrite concentrations depend partly on placental permeability which has not been determined experimentally. We aimed to extract the placental permeability-surface (PS) product for nitrite in sheep from a computational model.
Methods: An eight-compartment computational model of the fetal-maternal unit was constructed (Matlab(®) (R2013b (8.2.0.701), MathWorks Inc., Natick, MA). Taking into account fetal and maternal body weights, four variables (PS, the rate of nitrite metabolism within red cells, and two nitrite distribution volumes, one with and one without nitrite metabolism), were varied to obtain optimal fits to the experimental plasma nitrite profiles observed following the infusion of nitrite into either the fetus (n = 7) or the ewe (n = 8).
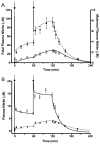
Results: The model was able to replicate the average and individual nitrite-time profiles (r(2) > 0.93) following both fetal and maternal nitrite infusions with reasonable variation of the four fitting parameters. Simulated transplacental nitrite fluxes were able to predict umbilical arterial-venous nitrite concentration differences that agreed with experimental values. The predicted PS values for a 3 kg sheep fetus were 0.024 ± 0.005 l∙min(-1) in the fetal-maternal direction and 0.025 ± 0.003 l∙min(-1) in the maternal-fetal direction (mean ± SEM). These values are many-fold higher than the reported PS product for chloride anions across the sheep placenta.
Conclusion: The result suggests a transfer of nitrite across the sheep placenta that is not exclusively by simple diffusion through water-filled channels.
Keywords: Nitrite; Placental transfer; Sheep; Simulation.
Copyright © 2015 Elsevier Ltd. All rights reserved.
Conflict of interest statement
No conflicts of interest are declared by the authors.
Figures


Similar articles
-
Characterization of transplacental transfer of paroxetine in perfused human placenta: development of a pharmacokinetic model to evaluate tapered dosing.Drug Metab Dispos. 2013 Dec;41(12):2124-32. doi: 10.1124/dmd.113.052332. Epub 2013 Sep 17. Drug Metab Dispos. 2013. PMID: 24046332
-
Metabolism of glucose by fetus and placenta of sheep. The effects of normal fluctuations in uterine blood flow.J Dev Physiol. 1987 Aug;9(4):369-89. J Dev Physiol. 1987. PMID: 3655221
-
In vivo kinetic study of materno-fetal fatty acid transfer in obese and normal weight pregnant women.J Physiol. 2019 Oct;597(19):4959-4973. doi: 10.1113/JP278146. Epub 2019 Jul 24. J Physiol. 2019. PMID: 31287560
-
Placental transport function.Reprod Fertil Dev. 1991;3(4):345-53. doi: 10.1071/rd9910345. Reprod Fertil Dev. 1991. PMID: 1957022 Review.
-
In vivo characteristics of placental amino acid transport and metabolism in ovine pregnancy--a review.Placenta. 2002 Apr;23 Suppl A:S3-8. doi: 10.1053/plac.2002.0812. Placenta. 2002. PMID: 11978054 Review.
Cited by
-
Evidence for placental-derived iron-nitrosyls in the circulation of the fetal lamb and against a role for nitrite in mediating the cardiovascular transition at birth.Am J Physiol Regul Integr Comp Physiol. 2020 Oct 1;319(4):R401-R411. doi: 10.1152/ajpregu.00196.2020. Epub 2020 Aug 19. Am J Physiol Regul Integr Comp Physiol. 2020. PMID: 32813540 Free PMC article.
References
-
- Lundberg JO, Weitzberg E. NO-synthase independent NO generation in mammals. Biochem Biophys Res Commun. 2010;396:39–45. - PubMed
Publication types
MeSH terms
Substances
Grants and funding
LinkOut - more resources
Full Text Sources
Other Literature Sources

