. 2016 Feb 23;11(2):e0150102.
doi: 10.1371/journal.pone.0150102. eCollection 2016.

Constitutively Elevated Blood Serotonin Is Associated with Bone Loss and Type 2 Diabetes in Rats

Affiliations

Constitutively Elevated Blood Serotonin Is Associated with Bone Loss and Type 2 Diabetes in Rats

Igor Erjavec et al. PLoS One. .

Abstract

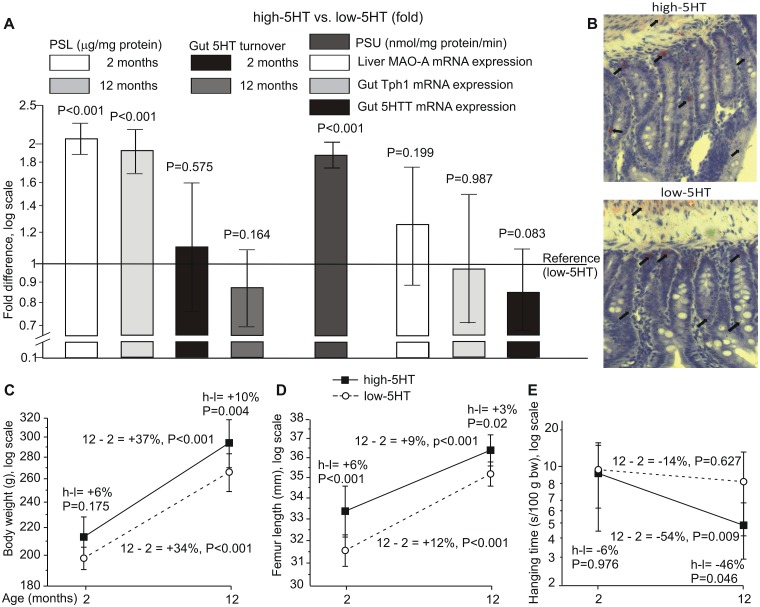
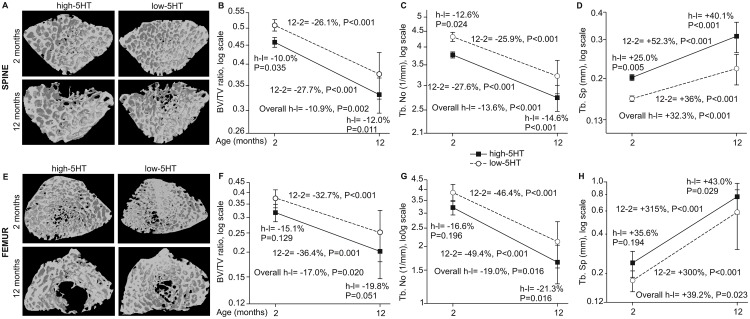
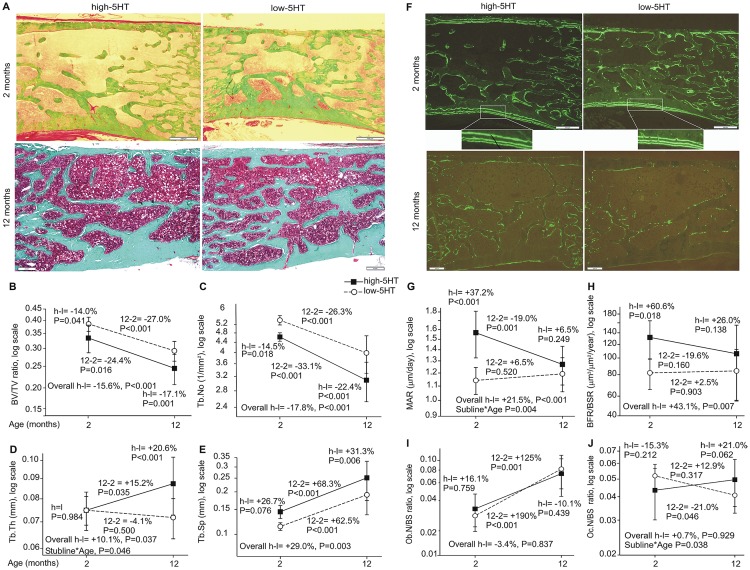
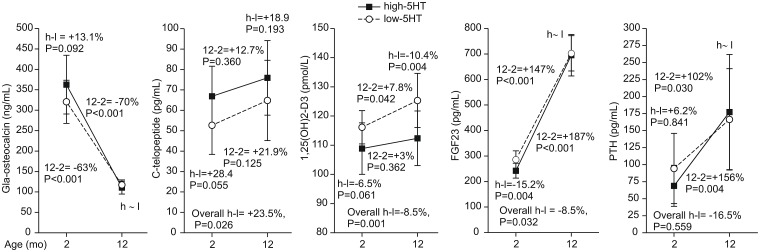
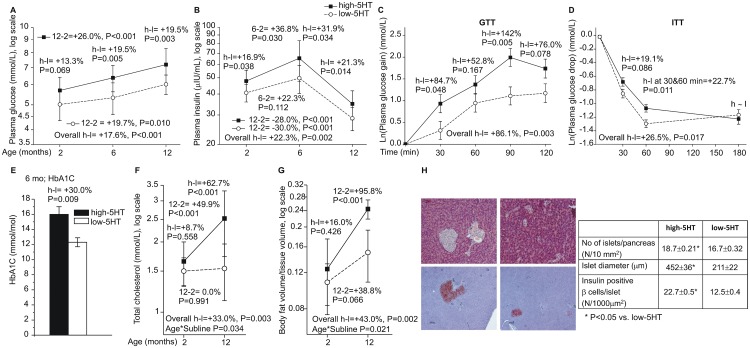
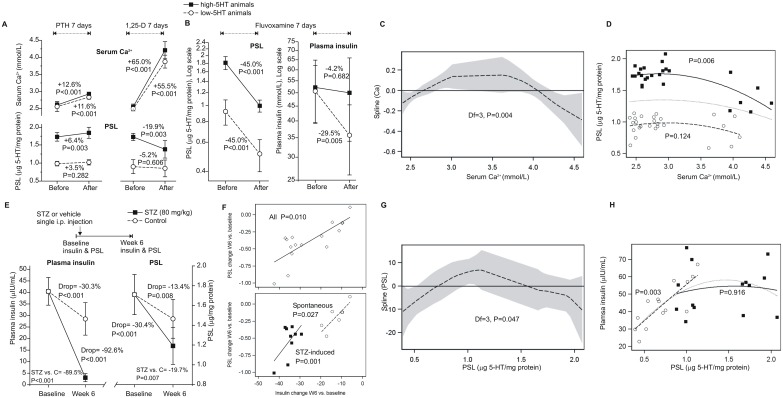
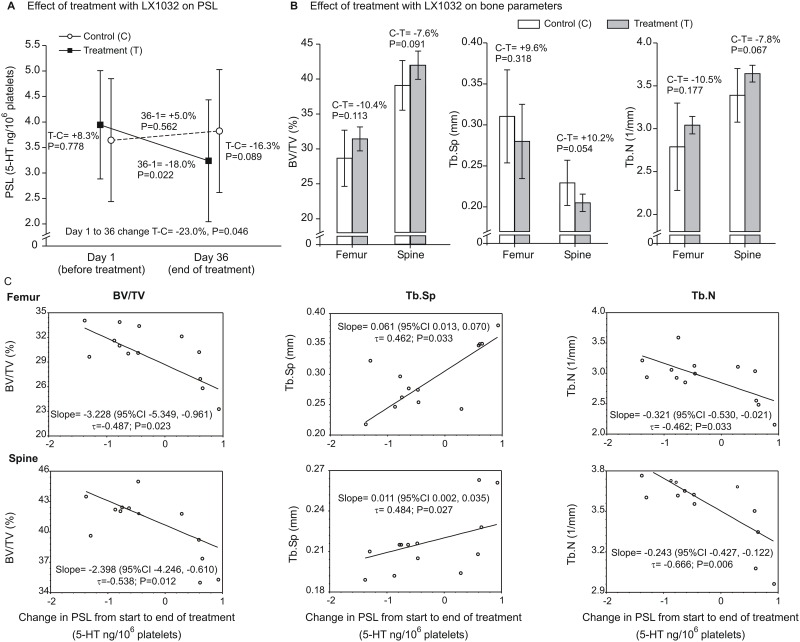
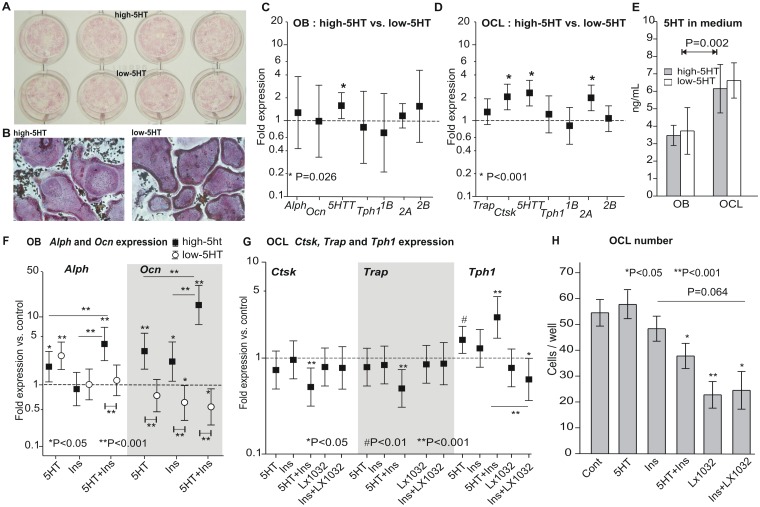
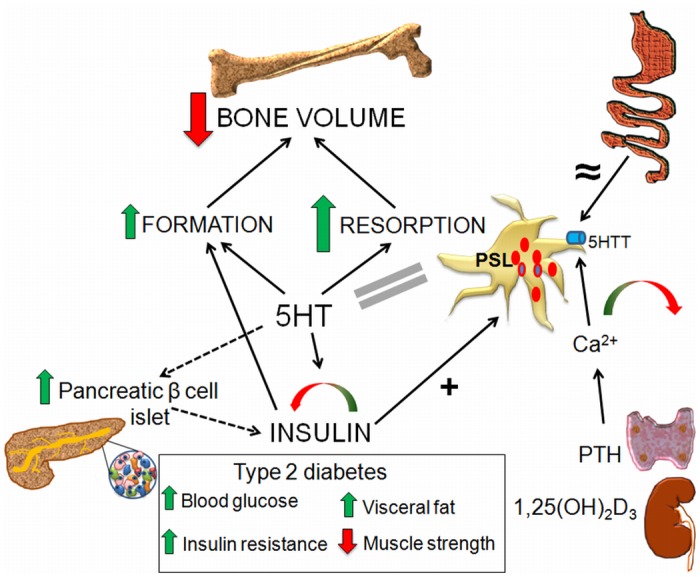
Reduced peripheral serotonin (5HT) in mice lacking tryptophan hydroxylase (TPH1), the rate limiting enzyme for 5HT synthesis, was reported to be anabolic to the skeleton. However, in other studies TPH1 deletion either had no bone effect or an age dependent inhibition of osteoclastic bone resorption. The role of 5HT in bone therefore remains poorly understood. To address this issue, we used selective breeding to create rat sublines with constitutively high (high-5HT) and low (low-5HT) platelet 5HT level (PSL) and platelet 5HT uptake (PSU). High-5HT rats had decreased bone volume due to increased bone turnover characterized by increased bone formation and mineral apposition rate, increased osteoclast number and serum C-telopeptide level. Daily oral administration of the TPH1 inhibitor (LX1032) for 6 weeks reduced PSL and increased the trabecular bone volume and trabecular number of the spine and femur in high-5HT rats. High-5HT animals also developed a type 2 diabetes (T2D) phenotype with increased: plasma insulin, glucose, hemoglobin A1c, body weight, visceral fat, β-cell pancreatic islets size, serum cholesterol, and decreased muscle strength. Serum calcium accretion mediated by parathyroid hormone slightly increased, whereas treatment with 1,25(OH)2D3 decreased PSL. Insulin reduction was paralleled by a drop in PSL in high-5HT rats. In vitro, insulin and 5HT synergistically up-regulated osteoblast differentiation isolated from high-5HT rats, whereas TPH1 inhibition decreased the number of bone marrow-derived osteoclasts. These results suggest that constitutively elevated PSL is associated with bone loss and T2D via a homeostatic interplay between the peripheral 5HT, bone and insulin.


Conflict of interest statement

Competing Interests: I have read the journal's policy and the authors of this manuscript have the following competing interests: WZ and VMP are employees of Karos Pharmaceuticals which supplied the research with compound LX1032, which is a TPH1 specific inhibitor, and performed HPLC analyses. There are no patents, products in development or marketed products to declare. This does not alter the authors’ adherence to all the PLOS ONE policies on sharing data and materials, as detailed online in the guide for authors.

Figures

Fig 1
Fig 1. Physiological characteristics of rats from high-serotonin (5HT) and low-5HT sublines.
A. Indicators of 5HT homeostasis shown as “fold difference” between high- and low-5HT animals with 95% confidence intervals. Reference values were (mean±SD): a) for platelet serotonin level (PSL) 0.80±0.08 μg 5HT/mg platelet protein; b) for platelet serotonin uptake (PSU) 0.69±0.07 nmol 5HT/mg platelet protein/min. Rats were 2 months (PSU measurements) and 12 months (gut Mao-A, Tph1 and 5HTT expression) of age. PSL and gut 5HT turnover data are given for animals of 2 and 12 months of age. B. No difference in 5HT production and storage in the gut was observed between high- and low-5HT rat sublines. 5HT visualized by using immunohistochemistry was documented at 40× magnification and is depicted by black arrows. C-E. Physical characteristics of high-5HT and low-5HT animals (mean±SD). High-5HT animals are represented by black squares, low-5HT animals by open circles. C—body weight; D—femur length; E—hanging time in the string test (mean values from three 60-sec trials separated by 10-min intervals). Relative differences (%) are shown for subline*age interaction contrasts. P-values were adjusted for multiple comparisons (n = 6–15 rats/group). H-L indicates a difference between high-5HT and low-5HT animals. 12–2 indicates a difference between 12 months and 2 months old animals. Mao-A—monoamine oxidase A; Tph1 –tryptophan hydroxylase 1; 5HTT—serotonin transporter
Fig 2
Fig 2. 3D model of trabecular bone reconstructed from μCT images for lumbar spine and distal femur in high-5HT and low-5HT rats at 2 and 12 months of age.
A. Spine—μCT images. B-D. Spine—morphometric indices (mean±SD). E. Femur—μCT images. F-H. Femur—morphometric indices (mean±SD). Shown are relative differences (%): H-L (high-5HT vs. low-5HT animals) at different age; 12–2 months for high and low 5HT animals (n = 8–14 rats/group). Depicted are relative differences (%): for the overall difference between the high-5HT and low-5HT sublines, P<0.05 is considered significant; for contrasts between sublines at a given age and between different ages within the same subline, P<0.025 is considered significant.
Fig 3
Fig 3. Histomorphometric analysis of the lumbar spine in high-5HT and low-5HT rats at 2 and 12 months of age.
A-E Light microscopy and static morphometric parameters. F-G Fluorescent microscopy and dynamic morphometric parameters. I. Osteoblast numbers. J. Osteoclast numbers. Data are mean+/-SD (n = 8–14 rats/group). Depicted are relative differences (%): for the overall difference between the high-5HT and low-5HT sublines (h-l) and for the subline*age interaction (depicted only where significant), P<0.05 is considered significant; for contrasts between sublines at a given age and between different ages within the same subline, P<0.025 is considered significant. Boxes represent 500 μm.
Fig 4
Fig 4. Bone biomarkers and hormones in high-5HT and low-5HT rats.
Depicted are relative differences (%): for the overall difference between the high-5HT (H) and low-5HT (L) sublines, P<0.05 is considered significant; for contrasts between sublines at a given age and between different ages within the same subline, P<0.025 is considered significant (n = 5–10 rats/group). H-L indicates a difference between high-5HT and low-5HT animals. 12–2 indicates a difference between 12 months and 2 months old animals.
Fig 5
Fig 5. Development of glucose and lipid metabolism alterations with age in high-5HT and low-5HT rats.
A-B. Plasma glucose and insulin levels (mean±SD, n = 7–24). C-D. Glucose metabolism functional tests in 6 months old animals. Data are least square mean±SE gain (GTT) or drop (ITT) in glucose levels (n = 8–10). E. Plasma HbA1c in 6 months old rats (mean±SD, n = 3). F-G. Indicators of lipid metabolism in 2 and 12 months old rats (mean±SD, n = 6–10). H. Pancreatic beta islet analysis in high-5HT and low-5HT rats (n = 6). Depicted are relative differences (%): for the overall difference between the high-5HT and low-5HT sublines (h-l), and for subline*age interaction (indicated only where significant), P<0.05 is considered significant; for contrasts between sublines at a given age (or time in GTT/ITT), and between different ages within the given subline, P<0.025 is considered significant. Analysis of GTT and ITT data was adjusted for baseline glucose levels. GTT- glucose tolerance test; ITT—insulin tolerance test.
Fig 6
Fig 6. Effects of pharmacological interventions on serum Ca2+, PSL and plasma insulin levels in high-5HT and low-5HT rats, and relationships between them.
A. Effects of a 7-day treatment with 10 μg/kg/day PTH or with 1 μg/kg/day 1,25(OH)2D3 on serum Ca2+ and PSL (mean±SD, n = 6–7 animals/group). B. Effects of a 7-day treatment with 20 mg/kg/day fluvoxamine on PSL and plasma insulin (mean±SD, n = 6–7 rats/group). C. Relationship between serum Ca2+ (independent) and PSL (dependent): exploratory non-parametric regression with a cubic spline smoother (dashed line; shaded area = 95% confidence interval) indicated a quadratic Ca2+- PSL relationship (deviance Chi2 = 13.9, DF = 3, P = 0.004). D. Relationship between serum Ca2+ and PSL: a mixed-effect model (repeated measures, two experiments) with quadratic Ca2+ (model fit quadratic Ca2+ -2ResLL = -25.3; AIC = -19.3 vs. -2ResLL = -31.9, AIC = -25.9 for linear Ca2+) and calcium*subline interaction term (P = 0.021). High-5HT rats = black squares (data) and a full line (fit) (coeff. = -0.028, SE = 0.011); low-5HT rats = open circles and a dashed line (coeff. = -0.006, SE = 0.005). Dotted line = quadratic fit for overall data (coeff. = -0.017, SE = 0.007; P = 0.008). E. Effect of streptozotocin (STZ)-induced diabetes on plasma insulin and PSL in high-5HT animals. F. Relationship between PSL and plasma insulin in a streptozotocin-induced diabetes model. G-H. Relationship between PSL (independent) and plasma insulin (dependent): exploratory non-parametric regression with a cubic spline smoother (dashed line; shaded area = 95% confidence interval) indicated a quadratic PSL—insulin relationship (deviance Chi2 = 7.9, DF = 3, P = 0.047). Exploratory non-parametric regression indicated a quadratic Ca2+- PSL and quadratic PSL—insulin relationship.
Fig 7
Fig 7. In vivo effects of Tph1 inhibition on platelet serotonin levels (PSL) and bone parameters in 12 months old high 5-HT subline.
On day 1 of the experiment, PSL was measured and treatment with LX1032 (25 mg/kg) (n = 7) or vehicle (control, n = 6) was commenced. At the last day of treatment (Day 36), PSL was determined again. Animals were sacrificed 24 h after the last dose and bone volume (BV/TV, %), trabecular spacing (TbSp, mm) and number of trabecules (Tb.N, 1/mm) were determined in the femur and spine using μCT. A. Data are geometric means (±geometric SD) of PSL values on Day 1 and Day 36. A general linear mixed model (treatment, day [random], treatment*day interaction) was fitted to ln(PSL) and differences (expressed as percentages derived from geometric means ratios) were determined: a) in PSL between the two groups on days 1 and 36; b) in PSL between days 36 and 1, within each group; c) in change in PSL from Day 1 to Day 36 (interaction term coefficient) between the two groups. Adjustment for multiple comparisons was by the simulation method. B. Data are means (±SD) by bone parameter by group, separately for the femur and spine. A separate general linear model was fitted to each of the six ln-transformed outcomes. Differences between groups are expressed as percentage differences (derived from geometric means ratios). C. Non-parametric (Kendall's) regression of bone parameters on change in PSL from the start to the end of treatment. Data depict median slope with confidence interval, Kendall's tau coefficient and P-value.
Fig 8
Fig 8. In vitro studies on primary rat osteoblasts and osteoclasts.
A. Alkaline phosphatase staining of primary osteoblasts isolated from 5HT sublines. B. TRAP staining of primary osteoclasts isolated from 5HT sublines. C-D. Expression of mRNA for osteoblast (Alph, Ocn) and osteoclast (Trap, Ctsk) differentiation markers and 5HT-related molecules (5HTT, Tph1, 5HT-1B, -2A and -2B receptors) in rat primary osteoblast (C) and osteoclast cultures (D) (n = 3–5). E. Levels of 5HT measured in media from primary high-5HT and low-5HT rat osteoblasts and osteoclasts (n = 4). F. Effects of added 5HT, insulin and their combination on Alph and Ocn expression from primary osteoblasts isolated from high-5HT and low-5HT rats (n = 3). G-H. Effects of added 5HT, insulin and LX1032 on Ctsk, Trap, and Tph1 mRNA expression (G) (n = 3) and osteoclast number (H) (n = 4–7 wells analyzed per group) in primary osteoclast cultures from control Wistar rats. Expression data (C, D, F, G) are shown as fold difference over a control (indicated by the dashed line) with 95% confidence intervals. Stars (*) at estimates indicate significance vs. control, whereas horizontal lines and associated stars indicate significance in fold difference over control between treatments.
Fig 9
Fig 9. Systemic role of the peripheral 5HT.
Gut synthesized 5HT enters the platelets via the 5HTT. The quantity of 5HT in platelets depends on the 5HTT activity, while the rate of 5HT synthesis in the gut is equal between both rat sublines (≈ sign). Changes in the serum Ca2+ level, influenced by PTH from parathyroid glands and by 1,25(OH)2D3 from the kidney, impact the platelet 5HTT activity, with a bidirectional effect on PSL (green-red arrow). Elevated 5HT bidirectionally influences the plasma insulin level (green-red arrow) and induces the hyperthrophy of pancreatic β-cells (dashed arrow), leading to type 2 diabetes with an increased plasma glucose, insulin resistance, glucose intolerance, visceral fat volume and decreased muscle strength. In return, plasma insulin level positively correlates with the PSL (+ sign). Increased insulin and 5HT have an additive effect on bone formation (green arrow). Elevated 5HT increases both bone formation and resorption (larger green arrow), thus increasing the bone turnover and resulting in the net bone loss (large red arrow). 5HT—serotonin, 5HTT—serotonin transporter, PSL—plasma serotonin level, PTH—parathyroid hormone.

Similar articles

Cited by

References

    1. Yadav VK, Ryu JH, Suda N, Tanaka KF, Gingrich JA, Schutz G, et al. (2008) Lrp5 controls bone formation by inhibiting serotonin synthesis in the duodenum. Cell 135: 825–837. 10.1016/j.cell.2008.09.059 - DOI - PMC - PubMed
    1. Kode A, Mosialou I, Silva BC, Rached MT, Zhou B, Wang J, et al. (2012) FOXO1 orchestrates the bone-suppressing function of gut-derived serotonin. J Clin Invest 122: 3490–3503. 10.1172/JCI64906 - DOI - PMC - PubMed
    1. Cui Y, Niziolek PJ, MacDonald BT, Zylstra CR, Alenina N, Robinson DR, et al. (2011) Lrp5 functions in bone to regulate bone mass. Nat Med 17: 684–691. 10.1038/nm.2388 - DOI - PMC - PubMed
    1. Brommage R, Liu J, Doree D, Yu W, Powell DR, Melissa Yang Q (2015) Adult Tph2 knockout mice without brain serotonin have moderately elevated spine trabecular bone but moderately low cortical bone thickness. Bonekey Rep 4: 718 10.1038/bonekey.2015.87 - DOI - PMC - PubMed
    1. Brommage R, Liu J, Hansen GM, Kirkpatrick LL, Potter DG, Sands AT, et al. (2014) High-throughput screening of mouse gene knockouts identifies established and novel skeletal phenotypes. Bone Res 2: 14034 10.1038/boneres.2014.34 - DOI - PMC - PubMed

Publication types