

Does Churning in Medicaid Affect Health Care Use?
- PMID: 26908088
- PMCID: PMC5548183
- DOI: 10.1097/MLR.0000000000000509
Does Churning in Medicaid Affect Health Care Use?
Abstract
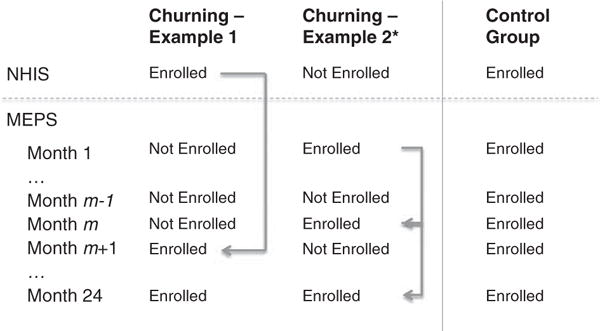
Background: Transitions into and out of Medicaid, termed churning, may disrupt access to and continuity of care. Low-income, working adults who became eligible for Medicaid under the Affordable Care Act are particularly susceptible to income and employment changes that lead to churning.
Objective: To compare health care use among adults who do and do not churn into and out of Medicaid.
Data: Longitudinal data from 6 panels of the Medical Expenditure Panel Survey.
Methods: We used differences-in-differences regression to compare health care use when adults reenrolled in Medicaid following a loss of coverage, to utilization in a control group of continuously enrolled adults.
Outcome measures: Emergency department (ED) visits, ED visits resulting in an inpatient admission, and visits to office-based providers.
Results: During the study period, 264 adults churned into and out of Medicaid and 627 had continuous coverage. Churning adults had an average of approximately 0.05 Medicaid-covered office-based visits per month 4 months before reenrolling in Medicaid, significantly below the rate of approximately 0.20 visits in the control group. Visits to office-based providers did not reach the control group rate until several months after churning adults had resumed Medicaid coverage. Our comparisons found no evidence of significantly elevated ED and inpatient admission rates in the churning group following reenrollment.
Conclusions: Adults who lose Medicaid tend to defer their use of office-based care to periods when they are insured. Although this suggests that enrollment disruptions lead to suboptimal timing of care, we do not find evidence that adults reenroll in Medicaid with elevated acute care needs.
Conflict of interest statement
The authors declare no conflict of interest.
Figures

References
-
- Agency for Health Care Research and Quality. Authors’ Calculations From the 2011 MEPS-Household Component. Rockville, MD: Medical Expenditure Panel Survey; 2013.
-
- Sommers BD, Rosenbaum S. Issues in health reform: how changes in eligibility may move millions back and forth between Medicaid and insurance exchanges. Health Aff. 2011;30:228–236. - PubMed
-
- Dyman K, Elmendorf D, Schiel D. The evolution of income volatility. Brookings Institution Paper; 2012. Available at: http://www.brookings.edu/~/media/research/files/papers/2013/1/household-.... Accessed May 2, 2015.
-
- Irregular work scheduling and its consequences. Economic Policy Institute; 2015. Available at: http://www.epi.org/publication/irregular-work-scheduling-and-its-consequ.... Accessed April 23, 2015.
-
- Kaiser Commission on Medicaid and the Uninsured. Holding Steady, Looking Ahead: Annual Findings of a 50-State Survey of Eligibility Rules, Enrollment, and Renewal Procedures, and Cost Sharing Practices in Medicaid and CHIP Table 14: Renewal Periods and Streamlined Renewal Processes for Parents in Medicaid. Washington, DC: Kaiser Commission on Medicaid and the Uninsured; 2011.
Publication types
MeSH terms
Grants and funding
LinkOut - more resources
Full Text Sources
Other Literature Sources
Medical
