. 2016 Feb 24:7:10767.
doi: 10.1038/ncomms10767.

Mutation allele burden remains unchanged in chronic myelomonocytic leukaemia responding to hypomethylating agents

Affiliations

Mutation allele burden remains unchanged in chronic myelomonocytic leukaemia responding to hypomethylating agents

Jane Merlevede et al. Nat Commun. .

Abstract

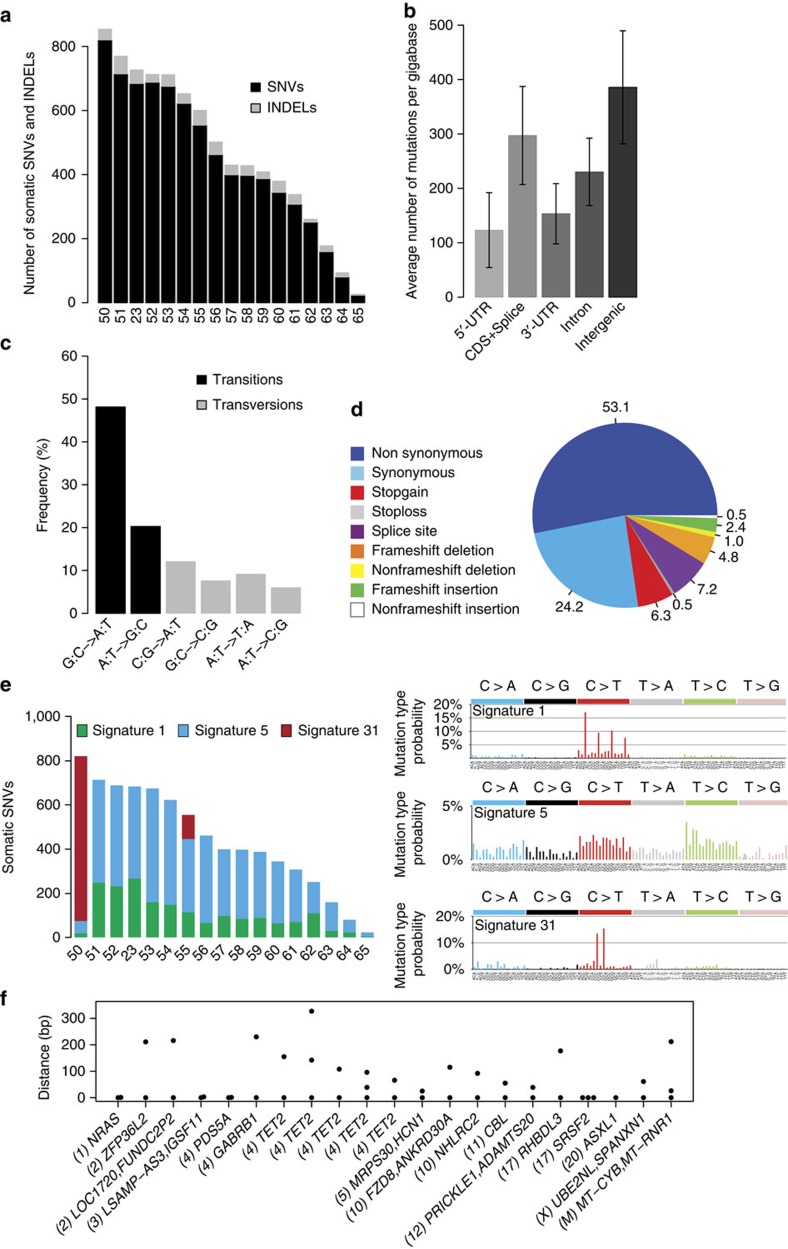
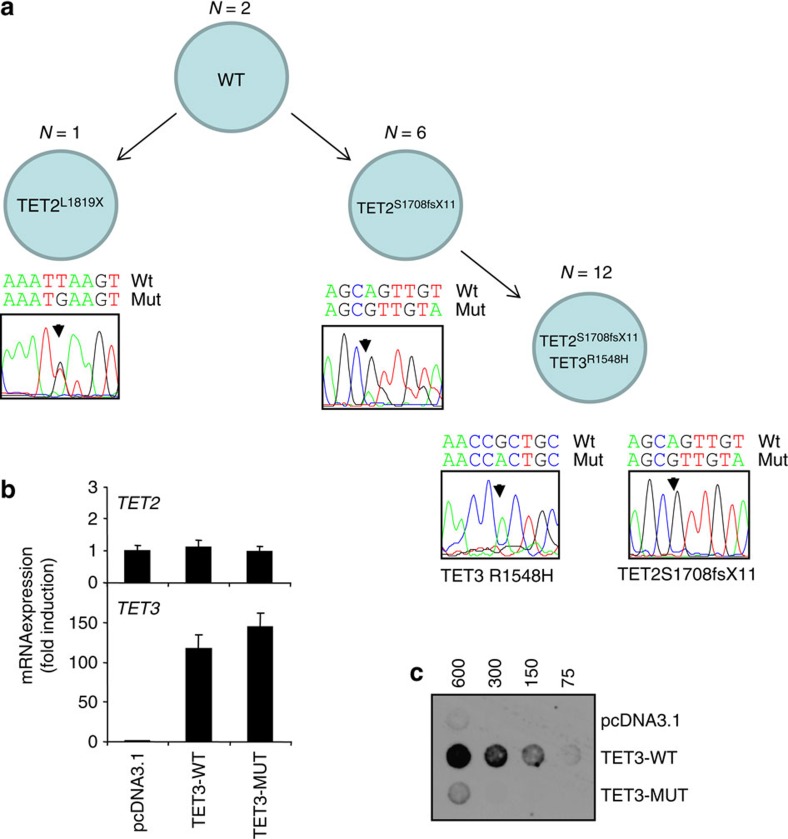
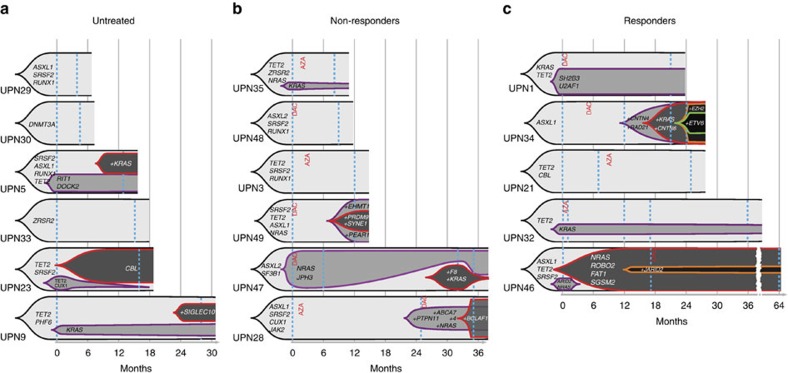
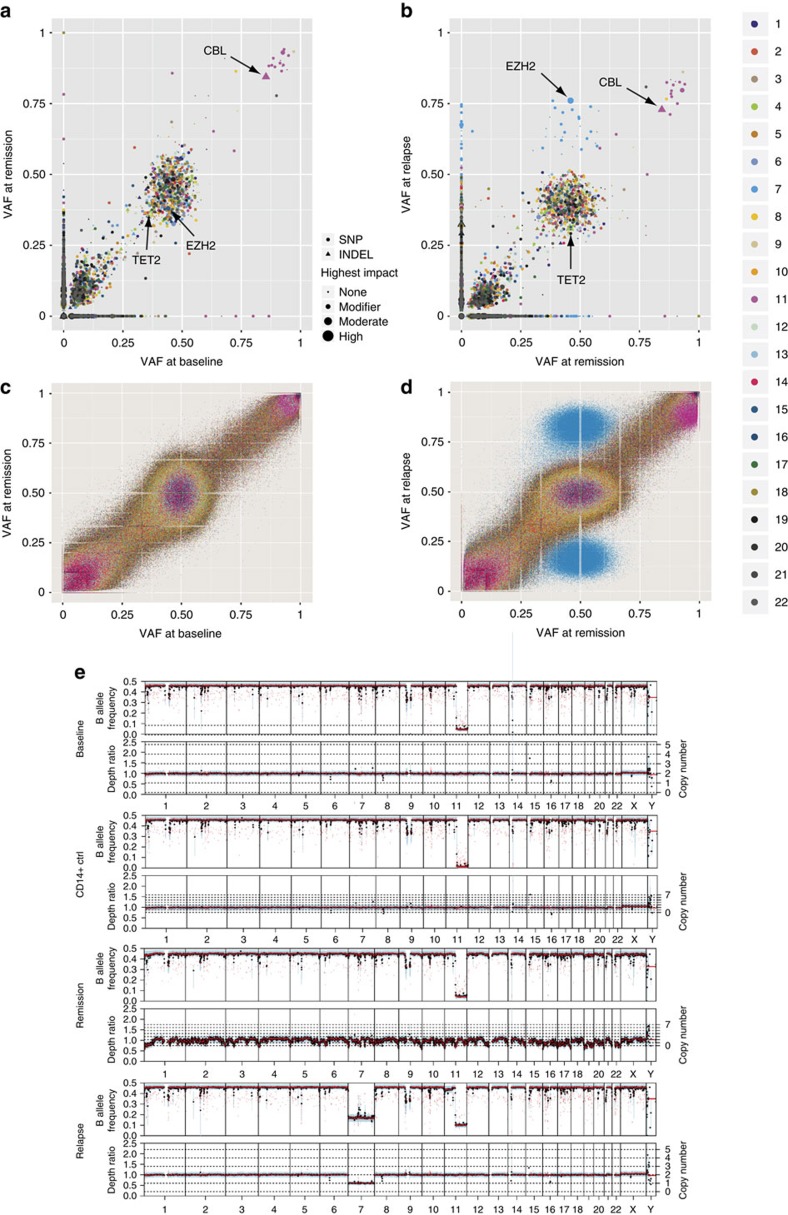
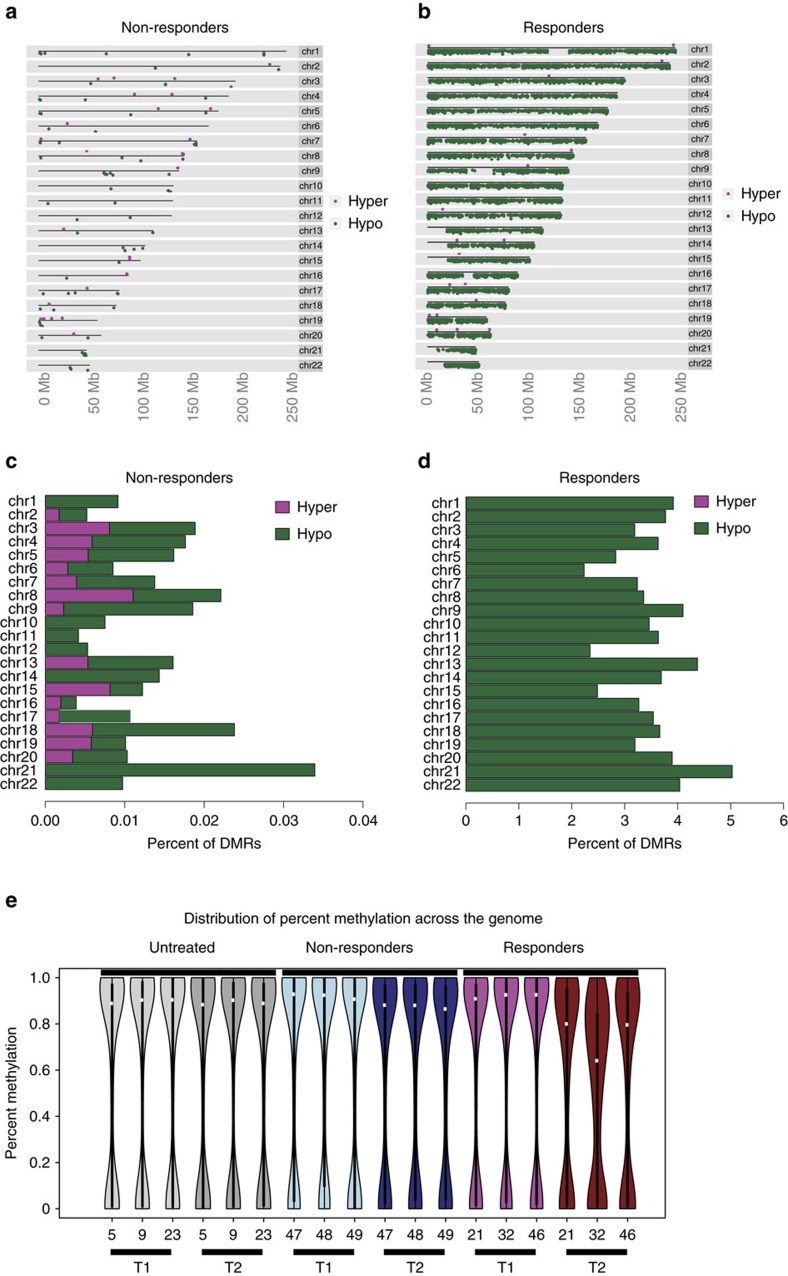
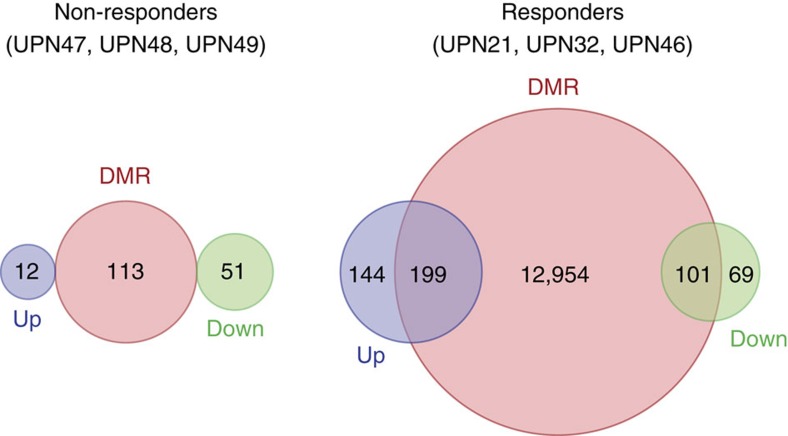
The cytidine analogues azacytidine and 5-aza-2'-deoxycytidine (decitabine) are commonly used to treat myelodysplastic syndromes, with or without a myeloproliferative component. It remains unclear whether the response to these hypomethylating agents results from a cytotoxic or an epigenetic effect. In this study, we address this question in chronic myelomonocytic leukaemia. We describe a comprehensive analysis of the mutational landscape of these tumours, combining whole-exome and whole-genome sequencing. We identify an average of 14±5 somatic mutations in coding sequences of sorted monocyte DNA and the signatures of three mutational processes. Serial sequencing demonstrates that the response to hypomethylating agents is associated with changes in DNA methylation and gene expression, without any decrease in the mutation allele burden, nor prevention of new genetic alteration occurence. Our findings indicate that cytosine analogues restore a balanced haematopoiesis without decreasing the size of the mutated clone, arguing for a predominantly epigenetic effect.


Figures

Figure 1
Figure 1. Somatic variants in coding regions identified by whole-exome sequencing.
WES was performed in 49 chronic myelomonocytic leukaemia samples. (a) Number and type of somatic mutations identified in each patient designated as UPN, showing a majority of nonsynonymous variants. (b) Repartition of the 680 validated somatic variants identified in the 49 patients. (c) Repartition of base changes with transitions in black and transversions in grey. (d) Of the 36 recurrently mutated genes identified by WES, 26 are actively transcribed in CD14+ cells and CD34+ cells (according to Gene Expression Omnibus at http://www.ncbi.nlm.nih.gov/geo/). These 26 recurrently mutated genes are classified according to their function, including epigenetic regulation, pre-messenger RNA splicing, and signal transduction. Colours indicate the type of mutation. Two colours separated by a slash indicate two distinct mutations in the same gene.
Figure 2
Figure 2. Somatic variants in coding and non-coding regions identified by whole-genome sequencing.
WGS was performed in 17 chronic myelomonocytic leukaemia samples (including one analysed by WES). (a) Number of somatic single-nucleotide variants and short insertions/deletions in each patient. (b) Repartition of the 8077 somatic variants, expressed as numbers of variants per gigabase, identified across the genomic regions. Mean and 95% confidence intervals (n=17) are shown. (c) Repartition of base changes with transitions in black and transversions in grey. (d) Repartition of the 207 somatic variants identified in coding regions. (e) Mutational signatures extracted from whole genomic analyses. (f) Potential hotspots of mutations (two variants less than 250 bp apart) including nine in coding regions of driver genes (including TET2, ASXL1, SRSF2, CBL and NRAS), two in intronic regions of PDS5A and NHLRC2, one in 3'UTR of ZFP36L2, six in intergenic regions and 1 in the mitochondrial chromosome. Numbers between comas indicate the chromosome number.
Figure 3
Figure 3. TET3–R1548H mutation inhibits 5hmC modification.
(a) Single cell analysis of TET3R1548H, TET2S1708fsX11 and TET2L1819X mutations in sorted CD14+ cells from UPN22. (b) TET2 and TET3 gene expression measured by quantitative reverse transcriptase–PCR in HEK293T cells transfected with the pcDNA3.1 empty vector or pcDNA3.1 encoding wild-type (TET3-WT) and R1548H TET3 (TET3-MUT). Reporter gene: RPL32. Results are related to pcDNA3.1 control. Error bars represent mean±standard deviation of triplicates. (c) Dot blot analysis of 5-hydroxymethylcytosine (5hmC) on genomic DNA (4-fold serial dilutions in ng) isolated from HEK293T cells transfected as in b.
Figure 4
Figure 4. Serial whole-exome sequencing analysis of somatic variants.
WES of sorted peripheral blood monocyte DNA was performed two- to fivefold in 17 patients at a mean interval of 14±8 months (range: 4–32). The clonal evolution of recurrently mutated genes is shown. UPN indicates the patient number. A selection of the variants detected by the first whole-exome sequencing is shown (all the variants identified in each individual patient are depicted in Supplementary Fig. 5). All the changes in variant allele frequency and new variants detected by repeating whole-exome sequencing are shown. Black indicates the founding clone and subsequent subclones are shown in violet, red, orange, and green, successively. Patients were either untreated (a) or treated with either azacytidine (AZA) or decitabine (DAC) as indicated in red. Blue dash lines indicate WES. (b) Patients with a stable disease on therapy. (c) Responding patients.
Figure 5
Figure 5. Serial whole-genome sequencing in a 5-AZA exceptional responder.
WGS was performed before 5-azatidine treatment (baseline), in complete response (remission) and at disease progression (relapse). (a,b) Scatter plot of somatic variants identified at baseline, remission, and progression. Chromosomal location is color coded and the size of the object denotes its predicted impact on protein function. High impact variants are those that are predicted to have the highest likelihood of altering protein expression or function such as frameshifts or nonsense variants. Circles denote single-nucleotide variants and triangles denote insertions or deletions. (c,d) Scatter plot of all variants identified with Freebayes at baseline, remission, and progression. Chromosomal location is color coded. (e) Copy number changes as identified from whole-genome sequencing data using Sequenza.
Figure 6
Figure 6. Evolution of gene expression pattern on hypomethylating agent therapy.
Gene expression was analysed at two time points in sorted peripheral blood monocytes from 9 chronic myelomonocytic leukaemia patients, including three untreated and six treated with either azacytidine or decitabine. These cases were randomly selected in each group. Three treated patients remained stable on therapy (non-responders) whereas the three others were responders. In treated patients, the first sample was collected before treatment, the second one after at least 5 drug cycles and just before the next cycle. Volcano plots of genes differentially expressed between these two time points are shown in non-responders (a) and in responders (b). The name of the most differentially deregulated genes is indicated. No significant change in gene expression was detected in untreated patients analysed twice at an at least 5-month interval (see also Table 1). Each dot (N=24,563) represents a gene; green dots, padj ≤0.05, orange dots, abs (log2 (fold change)) ≥1 and red dots, padj ≤0.05 and abs(log2 (fold change)) ≥1. (c) Quantitative reverse transcriptase–PCR validation of the differential expression of 8 genes in 6 responders (3 studied by RNA sequencing in b and 3 additional cases) and 10 non-responders (3 studied by RNA sequencing in a and 7 additional cases). Normalizer gene, RPL32. Similar results were obtained with two other normalizer genes, GUS and HPRT (Supplementary Fig. 8). (d) Significant changes in pathways detected by analysing RNA sequencing data with Ingenuity (www.ingenuity.com/products/ipa).
Figure 7
Figure 7. Evolution of DNA methylation pattern on hypomethylating drug therapy.
Methylation was analysed at two time points in sorted monocytes from nine chronic myelomonocytic leukaemia patients, including three untreated and six treated with either azacytidine or decitabine. Three treated patients remained stable on therapy (non-responders) whereas the three others were responders. In treated patients, the first sample was collected before treatment, the second one after at least five drug cycles and just before the next cycle. (a,b) Chromosome ideograms representing differentially methylated regions (DMRs) in non-responders (a) and in responders (b) are shown. Reduction in DNA methylation is in green, whereas increased methylation is in pink. (c,d) Barplots showing the percentage of genomic regions with significant changes in DNA methylation in non-responders (c) and in responders (d) are also shown. No change was identified in the 3 untreated patients (Table 1). (e) Violin plots showing the evolution of global methylation change in each patient (untreated patients in grey, treated with a stable disease (non-responders) in blue, treated responders in red with the lighter color indicating the earliest analysis.
Figure 8
Figure 8. Relationship between changes in DNA methylation and in gene expression.
Venn diagrams of interactions between differentially methylated regions (DMR, red circles) and differentially expressed genes (upregulated in blue; downregulated in green) as defined in Fig. 5 (padj ≤0.05 and abs(log2 (fold change)) ≥1).

References

    1. Vardiman J. W. et al.. The 2008 revision of the World Health Organization (WHO) classification of myeloid neoplasms and acute leukemia: rationale and important changes. Blood 114, 937–951 (2009). - PubMed
    1. Padron E. & Steensma D. P. Cutting the cord from myelodysplastic syndromes: chronic myelomonocytic leukemia-specific biology and management strategies. Curr. Opin. Hematol. 22, 163–170 (2015). - PubMed
    1. Jankowska A. M. et al.. Mutational spectrum analysis of chronic myelomonocytic leukemia includes genes associated with epigenetic regulation: UTX, EZH2, and DNMT3A. Blood 118, 3932–3941 (2011). - PMC - PubMed
    1. Itzykson R. et al.. Clonal architecture of chronic myelomonocytic leukemias. Blood 121, 2186–2198 (2013). - PubMed
    1. Kon A. et al.. Recurrent mutations in multiple components of the cohesin complex in myeloid neoplasms. Nat. Genet. 45, 1232–1237 (2013). - PubMed

Publication types

MeSH terms