. 2016 Feb 24:6:21930.
doi: 10.1038/srep21930.

Intermediate tree cover can maximize groundwater recharge in the seasonally dry tropics

Affiliations

Intermediate tree cover can maximize groundwater recharge in the seasonally dry tropics

U Ilstedt et al. Sci Rep. .

Abstract

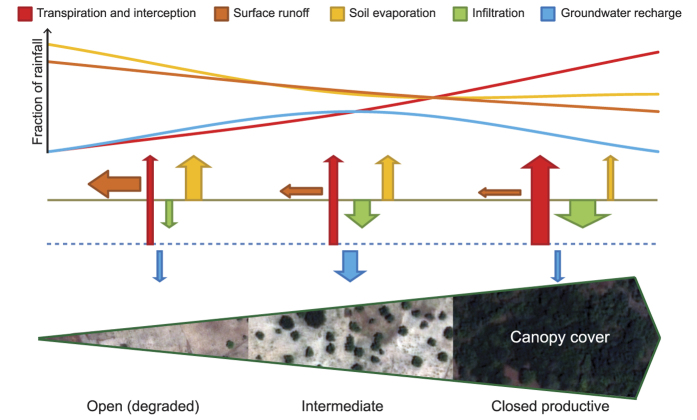
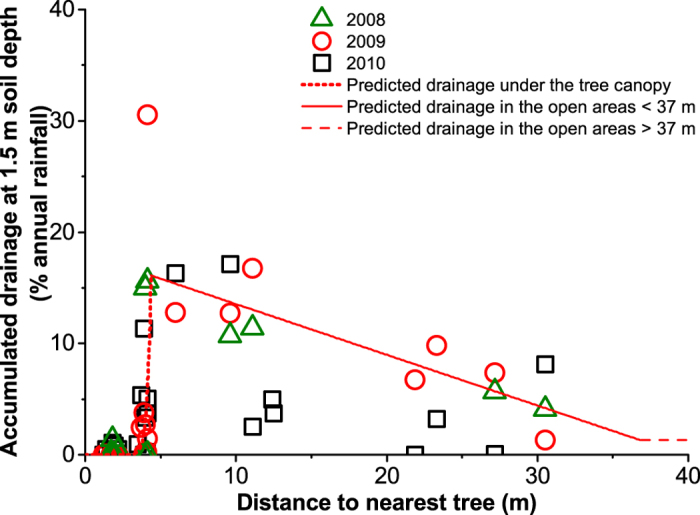
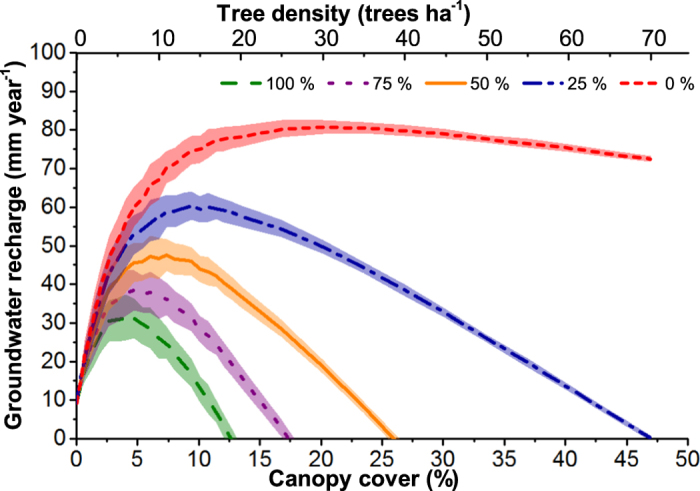
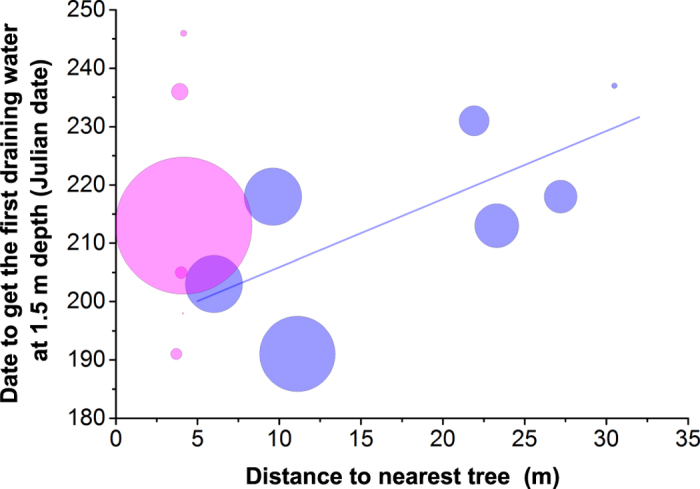
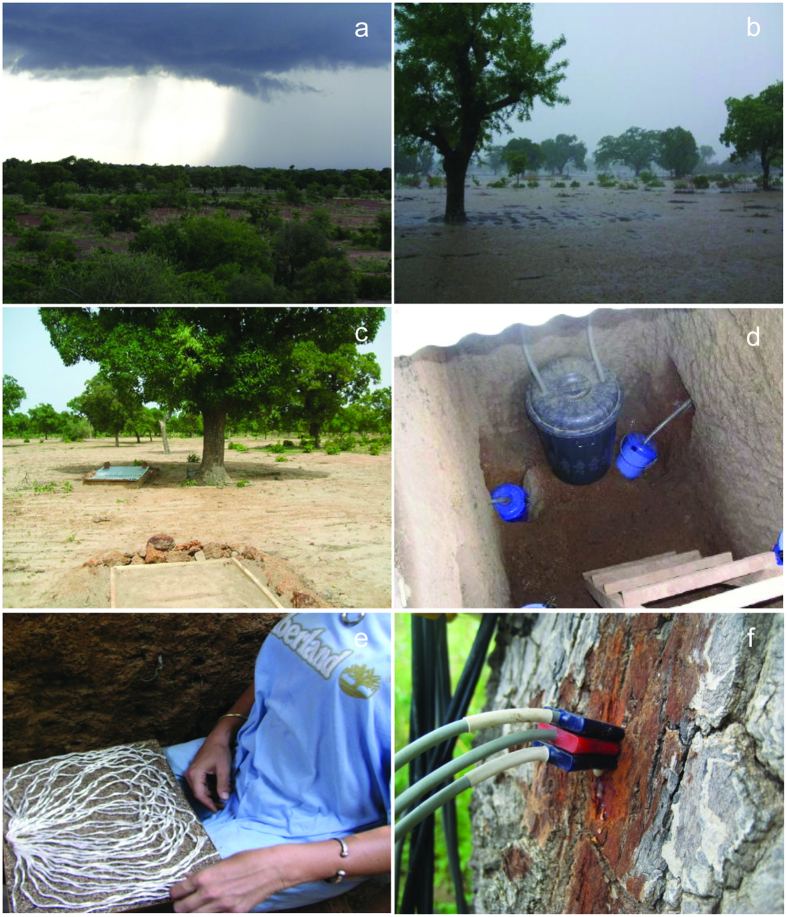
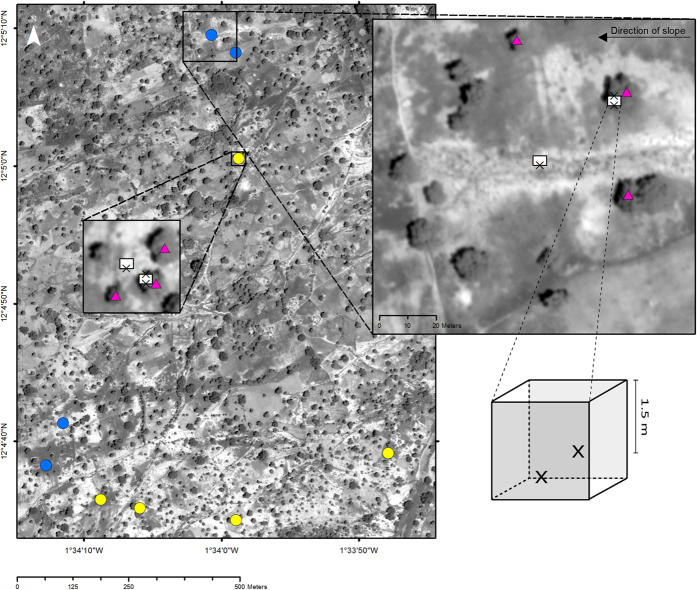
Water scarcity contributes to the poverty of around one-third of the world's people. Despite many benefits, tree planting in dry regions is often discouraged by concerns that trees reduce water availability. Yet relevant studies from the tropics are scarce, and the impacts of intermediate tree cover remain unexplored. We developed and tested an optimum tree cover theory in which groundwater recharge is maximized at an intermediate tree density. Below this optimal tree density the benefits from any additional trees on water percolation exceed their extra water use, leading to increased groundwater recharge, while above the optimum the opposite occurs. Our results, based on groundwater budgets calibrated with measurements of drainage and transpiration in a cultivated woodland in West Africa, demonstrate that groundwater recharge was maximised at intermediate tree densities. In contrast to the prevailing view, we therefore find that moderate tree cover can increase groundwater recharge, and that tree planting and various tree management options can improve groundwater resources. We evaluate the necessary conditions for these results to hold and suggest that they are likely to be common in the seasonally dry tropics, offering potential for widespread tree establishment and increased benefits for hundreds of millions of people.


Figures

Figure 1
Figure 1. Conceptual water budget of the optimum tree cover theory.
Optimum groundwater recharge occurs at intermediate tree cover in seasonally dry tropical areas. Without trees, surface runoff and soil evaporation are high, leading to low groundwater recharge despite low transpiration. In closed productive forests, despite low surface runoff and soil evaporation, total transpiration and interception are high, again leading to low groundwater recharge. At an intermediate canopy cover, low surface runoff and evaporation as well as intermediate transpiration optimize groundwater recharge. The pan-sharpened satellite images were created from a WorldView-2 image from 21 October 2012 using ERDAS Imagine 2013 software (http://www.hexagongeospatial.com/products/producer-suite/erdas-imagine).
Figure 2
Figure 2. Relationship between accumulated water drainage at 1.5 m soil depth and distance to nearest tree.
Accumulated drainage in open areas decreases with the distance from canopy edges in an agroforestry parkland, Burkina Faso. The lines show the relationship used for spatial simulations which was fitted by least squares regression to the 2009 data (see Methods section for details). The red solid line depicts the linear relationship found in the open areas (y = 18.1 − 0.46x; r2adj = 0.69, p = 0.013), while the red dotted line depicts the exponential relationship found under the tree canopy (y = 4.3 10−8 e4.5x; Lack of Fit test indicated a suitable model; p = 0.983). The dashed line is the constant value for the accumulated drainage corresponding to 1.3% of the annual rainfall assumed for the distance range above 37 m. The number of observations was 18, 22 and 25 in 2008, 2009 and 2010, respectively. In 2008, 2009 and 2010 the rainfall during the sampling period represented 85, 99 and 60% of the annual rainfall, respectively.
Figure 3
Figure 3. Spatial simulations of groundwater recharge in relation to tree density and canopy cover.
The simulations are based on sap flow measurements and on the observed relationship between drainage below 1.5 m soil depth in 2009 and distance to the nearest tree in an agroforestry parkland, Burkina Faso. For each tree density the averages and standard deviations resulting from 100 simulations with random locations of trees on a 1 ha area are shown. The effect of the proportion (0%, 25%, 50%, 75%, 100%) of tree water uptake below 1.5 m is demonstrated by the different colored lines. Average tree size (67 m2 canopy area) is assumed for all the simulations.
Figure 4
Figure 4. Scatter plot of the date when the first water was collected at each lysimeter versus the distance to the nearest tree (for 2009).
The pink and blue circles show lysimeters located under tree canopies and in open areas respectively. The size of the circles is proportional to the yearly accumulated water drainage at 1.5 m soil depth. The solid line shows the linear relationship found in the open areas (y = 194.2 + 1.2x, r2adj = 0.40, p = 0.075).
Figure 5
Figure 5. Saponé study area, Burkina Faso, and installations.
(a) Overview of the landscape from an elevated position. (b) Overland water flow during rainfall among the Shea trees (Vitellaria paradoxa) in the cultivated landscape. (c) Soil pits (see rectangular structures) under the canopy of a Shea tree (behind) and in the centre of an open area (front). (d) Lysimeter instalations on opposite sides of a soil pit at 1.5 m soil depth. One lysimeter was located towards the tree 1 to 2 m from the trunk; the second on the far side at 4 to 5 m from the trunk. (e) Passive capillary fiberglass wick lysimeter prior to installation. (f) HRM30 heat ratio probe for sap flow measurements attached to the stem of a Shea tree.
Figure 6
Figure 6. Overview of the study area and sampling design.
Satellite image (Panchromatic WorldView-2 image from 18 July 2012) of the study area showing the 9 sampling locations, 4 corresponding to large open areas (blue dots) and 5 corresponding to small open areas (yellow dots). Enlargements of a large and a small open area are also shown. The soil pits were located in each sampling location both at the centre of the open area and under a tree (white boxes). Soil water drainage was collected with lysimeters located at 1.5 m soil depth at three points in each sampling location (X). Sap flow was measured in three trees per sampling location (pink triangles).

References

    1. Kuylenstierna J. L., Björklund G. & Najlis P. The Comprehensive Assessment of the Freshwater Resources of the World-Policy Options for an Integrated Sustainable Water Future. Water Int. 23, 17–20 (1998).
    1. World Water Assessment Programme. The United Nations World Water Development Report 3: Water in a Changing World (UNESCO/Earthscan, Paris/London, 2009).
    1. Hamilton L. S. & King P. N. Tropical Forested Watersheds. Hydrologic and Soils Response to Major Uses or Conversions. (Westview Press, Colorado, 1983).
    1. Sandström K. Can forests “provide” water: widespread myth or scientific reality? Ambio 27, 132–138 (1998).
    1. Calder I. R. et al.. Forest and water policies–The need to reconcile public and science perceptions. Geol. Acta 2, 157–166 (2004).

Publication types

LinkOut - more resources