. 2016 Mar;28(3):661-79.
doi: 10.1105/tpc.16.00045. Epub 2016 Feb 23.

An Ancient Bacterial Signaling Pathway Regulates Chloroplast Function to Influence Growth and Development in Arabidopsis

Affiliations

An Ancient Bacterial Signaling Pathway Regulates Chloroplast Function to Influence Growth and Development in Arabidopsis

Matteo Sugliani et al. Plant Cell. 2016 Mar.

Abstract

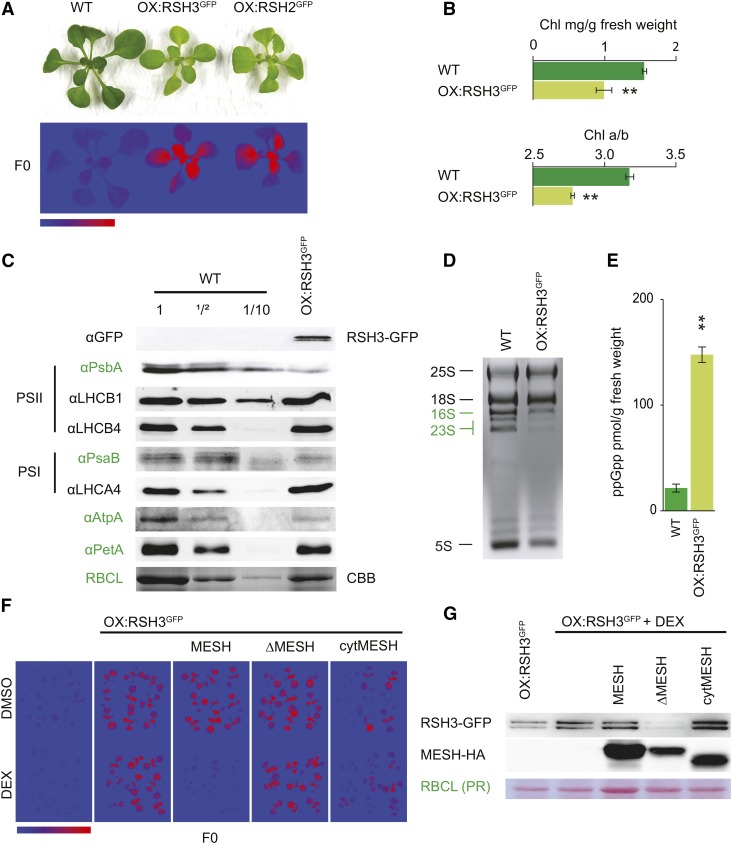
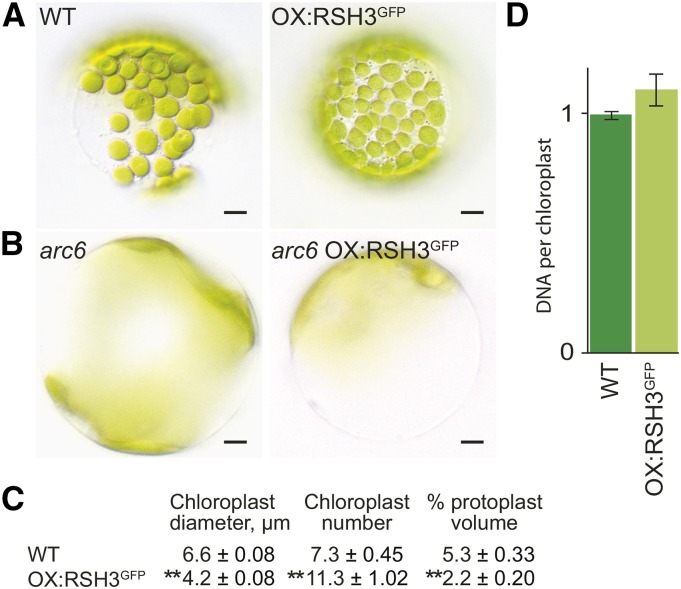
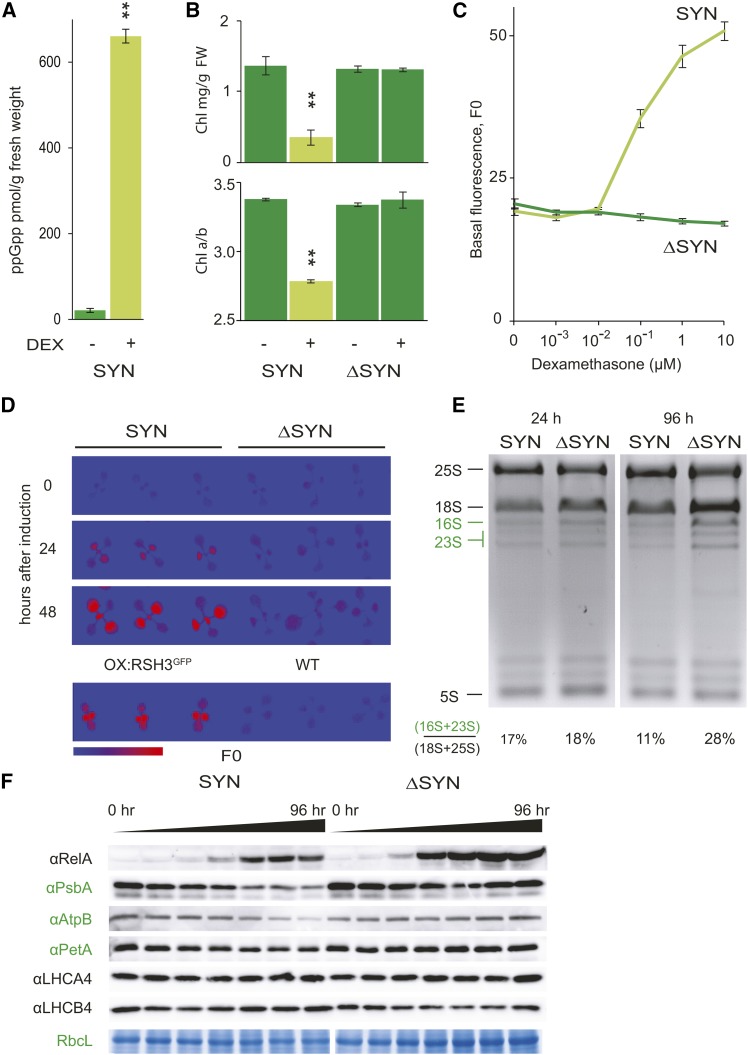
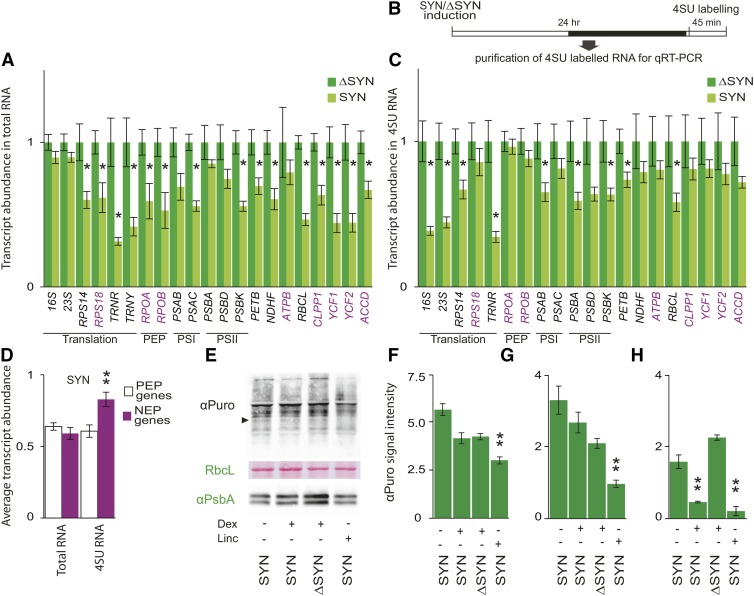
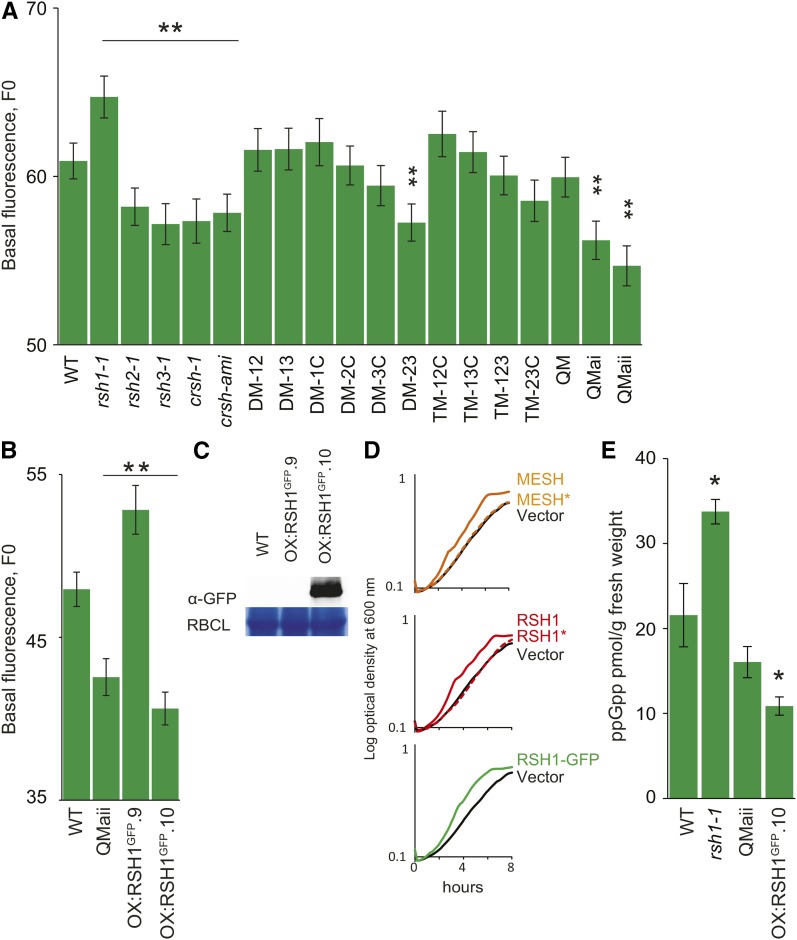
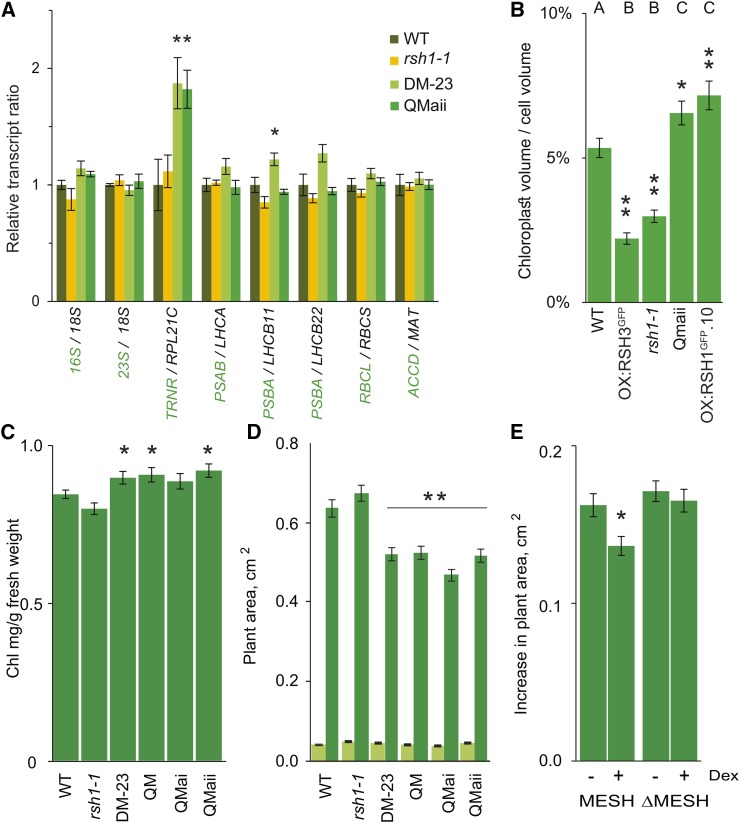
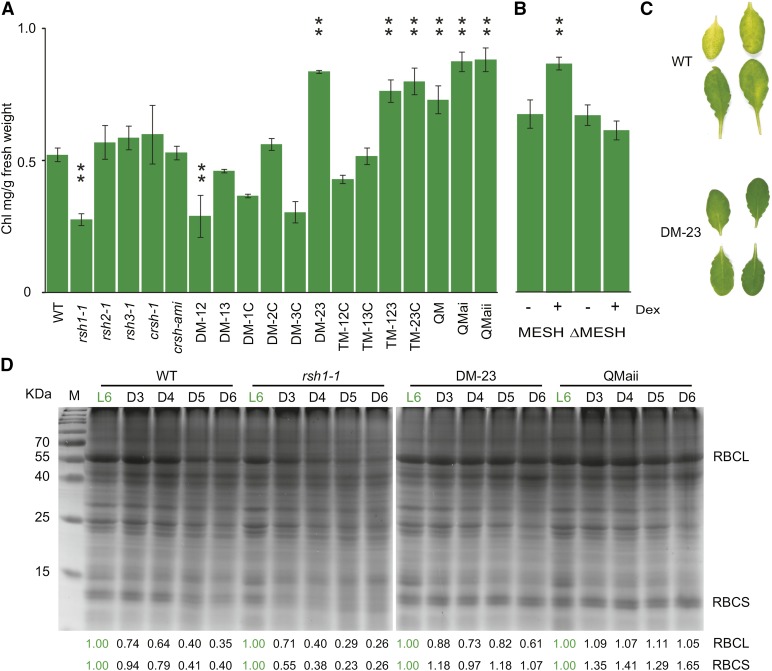
The chloroplast originated from the endosymbiosis of an ancient photosynthetic bacterium by a eukaryotic cell. Remarkably, the chloroplast has retained elements of a bacterial stress response pathway that is mediated by the signaling nucleotides guanosine penta- and tetraphosphate (ppGpp). However, an understanding of the mechanism and outcomes of ppGpp signaling in the photosynthetic eukaryotes has remained elusive. Using the model plant Arabidopsis thaliana, we show that ppGpp is a potent regulator of chloroplast gene expression in vivo that directly reduces the quantity of chloroplast transcripts and chloroplast-encoded proteins. We then go on to demonstrate that the antagonistic functions of different plant RelA SpoT homologs together modulate ppGpp levels to regulate chloroplast function and show that they are required for optimal plant growth, chloroplast volume, and chloroplast breakdown during dark-induced and developmental senescence. Therefore, our results show that ppGpp signaling is not only linked to stress responses in plants but is also an important mediator of cooperation between the chloroplast and the nucleocytoplasmic compartment during plant growth and development.


Figures

Figure 1.
Figure 1.
RSH3-GFP Overexpression Reduces Chloroplast Function. (A) OX:RSH3-GFP.1 (OX:RSH3GFP) and OX:RSH2-GFP.1 (OX:RSH2GFP) plants are small and pale (above) and have a high basal chlorophyll fluorescence, F0 (below). Plants shown were grown on plates for 16 DAS. F0 false-color scale bar, 50 to 350 arbitrary units. (B) OX:RSH3GFP.1 seedlings have significantly lower chlorophyll levels and chlorophyll a/b ratios than the wild type (n = 4 plants, 12 DAS). (C) Immunoblots on equal quantities or dilutions of total protein from wild-type seedlings and seedlings overexpressing RSH3-GFP 12 DAS using the indicated antibodies against signature chloroplast proteins. Chloroplast-encoded proteins are indicated by green text. RBCL was revealed by Coomassie Brilliant Blue staining (CBB). (D) Total RNA from wild-type plants and RSH3-GFP-overexpressing plants showing cytosolic (black) and chloroplastic rRNA (green). (E) ppGpp was extracted from the leaves of soil-grown plants 32 DAS and quantified by ultraperformance liquid chromatography-mass spectrometry; P = 0.00013, n = 3 biological replicates. (F) F0 images of wild-type plants, OX:RSH3-GFP.1 plants, and OX:RSH3-GFP.1 plants crossed with inducible MESH plants 12 DAS. Plants were grown on medium containing the carrier (DMSO) or 1 µM dexamethasone (DEX). MESH, catalytically active chloroplastic enzyme; ΔMESH, catalytically inactive chloroplastic enzyme; cytMESH, an active MESH targeted to the cytoplasm. cytMESH plants were segregating for OX:RSH3-GFP.1. (G) Immunoblots showing the accumulation of RSH3-GFP and MESH proteins in total extracts from the same plants as analyzed for F0 in (F). For cytMESH, only plants overexpressing RSH3-GFP were selected for protein extraction. PR, Ponceau Red. Significance was tested using the two-way Student’s t test, ** P < 0.01. Error bars indicate se.
Figure 2.
Figure 2.
ppGpp Accumulation in RSH3-GFP Plants Reduces Chloroplast Volume per Cell without Repressing Chloroplast Replication. (A) and (C) Mesophyll protoplasts were isolated from the leaves of wild-type and mutant plants 35 DAS, and representative protoplasts are shown. Chloroplasts in OX:RSH3-GFP.1 (OX:RSH3GFP) plants were smaller than those in the wild type (A) and chloroplast number was consistently higher (C), even when adjusted for protoplast volume (expressed as chloroplasts per 10,000 µm3). Despite increased numbers of chloroplasts, the percentage chloroplast volume per protoplast in OX:RSH3-GFP.1 plants was significantly lower than that in wild-type plants. Significance was calculated using the Kruskal-Wallis test with the Dunn test post hoc, **P < 0.0001. Data are presented as means ± se; 255 to 323 chloroplasts were measured for chloroplast diameter, and 30 to 59 protoplasts were measured for chloroplast number and protoplast volume in OX:RSH3-GFP.1 and the wild type. (B) Transfer of OX:RSH3-GFP.1 into the genetic background of the chloroplast division mutant arc6 suppressed the increased chloroplast number. arc6 OX:RSH3-GFP.1 plants also had a significantly lower chloroplast plan area per cell than arc6 plants alone (46% ± 2% se versus 62% ± 3% se, P < 0.0001, Kruskal-Wallis test, n = 13 to 16 protoplasts). (D) Chloroplast DNA content was quantified by qRT-PCR on chloroplasts isolated from wild-type and OX:RSH3-GFP.1 plants at 24 DAS. Data are presented as means ± se for three independent biological replicates.
Figure 3.
Figure 3.
Conditional Expression of a Bacterial ppGpp SYN Reduces Chloroplast Function. SYN plants contain a transgene encoding a chloroplast-targeted ppGpp synthase from bacteria under the control of a dexamethasone-inducible promoter. ΔSYN plants contain a transgene encoding a catalytically inactive variant of SYN. (A) SYN induction results in a large increase in ppGpp levels, P = 0.000003. ppGpp was extracted and quantified 72 h after induction of SYN seedlings grown on plates for 12 DAS by submersing with either the carrier (DMSO) or 30 µM dexamethasone (DEX) for 3 min. Data are presented as the means of three independent biological replicates. (B) and (C) SYN and ΔSYN seedlings were analyzed for chlorophyll content and chlorophyll a/b ratios 4 days after induction with dexamethasone, **P < 0.001, versus DMSO control (n = 4 plants) (B) and F0 after 8 d growth on plates containing different concentrations of dexamethasone (n = 18 plants) (F0, arbitrary units) (C). (D) to (F) After induction of SYN and ΔSYN plants 12 DAS, changes in F0 (F0 false-color scale bar, 50 to 350 arbitrary units) (D), rRNA (E), and chloroplast proteins (F) were followed. Chloroplast proteins were detected by immunoblots on equal quantities of protein using the indicated antibodies. Anti-RelA detects the SYN and ΔSYN proteins. Samples were taken at 0, 2, 4, 8, 24, 48, and 96 h after induction. RBCL was revealed by Coomassie Brilliant Blue staining. Chloroplast-encoded proteins and rRNAs are in green. Significance was calculated using the two-way Student’s t test. Error bars indicate se.
Figure 4.
Figure 4.
ppGpp Accumulation Reduces Chloroplast Transcript Levels but Does Not Have a Major Direct Effect on Chloroplast Translation. (A) qRT-PCR for selected chloroplast-encoded transcripts 24 h after the induction of ΔSYN and SYN seedlings grown on plates for 12 DAS. Transcripts produced only or significantly by NEP in green tissue (NEP genes) are indicated in purple, *P < 0.05, SYN versus ΔSYN for a single transcript. Data are presented as means ± se for four independent biological replicates, and transcript abundance was normalized to the nucleus-encoded 18S, APT1, PP2A, and ULP7 reference transcripts. (B) and (C) The transcription rates of chloroplast genes in induced SYN and ΔSYN plants were measured by labeling new transcripts with 4SU in vivo (B) and quantifying the abundance of purified 4SU transcripts by qRT-PCR (C). Data are presented as means ± se for four independent biological replicates, and transcript abundance was normalized to 18S, PP2A, and ULP7 reference genes. (D) The induction of SYN had significantly less effect on the transcription of NEP genes than it did on PEP genes; P = 0.0011, ANOVA with post-hoc Dunnett test, n = 8 to 11. Twenty-four fours after induction of SYN and ΔSYN seedlings, translation rates were also analyzed by quantifying the incorporation of puromycin into nascent proteins during 1 h. (E) Puromycin incorporation was assessed by immunoblot analysis on equal quantities of total chloroplast proteins (10 µg) using an antibody against puromycin. Plants treated with lincomycin for 24 h were used as a control. The black arrow indicates PsbA. RbcL is a loading and transfer control and is shown by Ponceau red staining on the same membrane used for puromycin detection. (F) Incorporation was quantified across five biological replicates. Lincomycin-treated SYN plants showed a significant drop in puromycin incorporation compared with induced SYN plants, **P < 0.01. No significant difference could be detected in the incorporation of puromycin between induced SYN and ΔSYN plants. (G) and (H) Puromycin incorporation into PsbA was also quantified at 24 h (G) and 72 h (H) after treatment, **P < 0.01, versus ΔSYN. Samples were normalized to total chloroplast protein. Unless stated otherwise, significance was calculated using the two-way Student’s t test. Error bars indicate se.
Figure 5.
Figure 5.
RSH Enzymes Mediate ppGpp Equilibrium during Vegetative Growth. (A) Basal chlorophyll fluorescence (F0, arbitrary units) was measured in the seedlings of a panel of 18 RSH mutants grown on plates for 12 DAS (n = 60 to 72 individual plants). crsh-ami, plants where CRSH is silenced by an artificial microRNA; DM-xy, double mutant for RSHx and RSHy; TM-xyz, triple mutant for RSHx, RSHy, and RSHz; QM, quadruple mutant with crsh-1 mutation; QMai and QMaii, quadruple mutants where CRSH is silenced by independent crsh-ami alleles. (B) and (C) The 12-DAS seedlings from RSH1-GFP overexpression lines were analyzed for F0 (n = 60 to 72 individual plants) (B) and RSH1-GFP protein accumulation by immunoblotting (C). The ppGpp hydrolase activity of different RSH enzymes was tested by expression in a slow-growing E. coli strain that overaccumulates ppGpp. (D) Bacterial growth curves were obtained by measuring optical density every 10 min over 8 h (average of four biological replicates). The expression of the ppGpp hydrolase MESH resulted in a significant acceleration of growth (doubling time, TD 1.84 h ± 0.003 h se for MESH versus 2.33 h ± 0.04 h se for the vector only control, P < 0.0001, two-way Student’s t test). RSH1 and RSH1-GFP also significantly accelerated growth of the mutant, indicating that they also act as ppGpp hydrolases (RSH1 TD 1.79 h ± 0.013 h se and RSH1-GFP TD 1.67 h ± 0.011 h se, P < 0.0001 versus vector only control, two-way Student’s t test). Mutation of the ppGpp hydrolase domains (MESH* and RSH1*) restored a slow growth phenotype indistinguishable from that of the vector only control. CRSH showed no activity in the same test, and RSH2 and RSH3 transformants could not be obtained to test, presumably due to overproduction of ppGpp. (E) Quantification of ppGpp in different mutant lines. ppGpp was extracted from the leaves of soil-grown plants 35 DAS and quantified by ultraperformance liquid chromatography-mass spectrometry, *P < 0.05, two-way Student’s t test. Data are presented as the means of three biological replicates. Large-scale extractions confirmed that ppGpp levels were significantly lower in than the wild type in QMaii and OX:RSH1-GFP.10 (Supplemental Figure 8). Unless otherwise stated, data were analyzed by ANOVA with post-hoc Dunnett tests versus the wild-type controls, *P < 0.05 and **P < 0.01. Error bars indicate se.
Figure 6.
Figure 6.
RSH Enzymes Are Required for Regulating Chloroplast Function, Volume, and Plant Growth. (A) Ratios of chloroplast (green) to nucleus-encoded (black) transcripts in different RSH mutants. qRT-PCR was performed on cDNA extracted from seedlings grown on plates for 12 DAS. Data are presented as means ± se for five independent biological replicates. Significance was calculated using ANOVA with post-hoc Dunnett tests versus the wild-type controls. (B) Total chloroplast volume per cell was calculated in protoplasts isolated from fully expanded leaves of plants grown on soil at 35 DAS. Representative protoplast images are shown in Supplemental Figure 9B. Statistical significance was calculated using Kruskal-Wallis with the Dunn test post hoc, and the resulting groups are indicated above each bar. Thirty protoplasts were analyzed for OX:RSH3-GFP.1 (OX:RSH3GFP) and 47 to 59 for the other lines. Similar results were also obtained using an independent approach on intact cells (Supplemental Figure 9C). (C) Chlorophyll levels were measured in selected RSH mutants grown on soil at 24 DAS. DM-23 and the QMs have a higher chlorophyll content than the wild type; two-way Student’s t test, n = 8 plants. (D) Plant surface area for wild-type and mutant seedlings grown on plates at 6 (light green) and 12 DAS (dark green) after stratification. Except for rsh1-1, which was larger (P < 0.0001), there were no significant differences between the mutants and the wild type at 6 DAS. Similar results were also obtained for plants grown in soil (Supplemental Figure 9D). Significance was calculated using ANOVA with post-hoc Dunnett tests versus the wild-type controls; n = 50 plants per line. (E) At 8 DAS, MESH and ΔMESH plants were transferred onto medium containing DMSO (control) or 1 µM dexamethasone (induced) and the increase in plant area was measured 4 d after transfer. The two-way Student’s t test was used to compare noninduced and induced plants. n = 36 plants,*P < 0 .05 and **P < 0.01, error bars indicate se.
Figure 7.
Figure 7.
The Antagonistic Activity of RSH Enzymes Is Critical for Senescence and Nutrient Remobilization. (A) and (B) Senescence was induced by incubating detached leaves in the darkness, and chlorophyll levels were measured after 5 d in a panel of 18 RSH mutants (A) and induced and noninduced MESH plants (B). MESH plants were induced by spraying plants with 10 µM dexamethasone (Dex) or the vehicle (DMSO) 48 h before the dark-induced senescence assay. Plants were grown for 48 d under short-day conditions, and chlorophyll levels were not significantly different between untreated lines. Data are presented as means ± se for extractions from three biological replicates and were analyzed by ANOVA with post-hoc Dunnett tests versus the wild-type controls, **P < 0.01. (C) A photograph of leaves from single plants 5 DAS treatment in (A). (D) Equal quantities of total protein were separated by SDS-PAGE and visualized by Coomassie Brilliant Blue staining after extraction from the leaves of selected lines after 3 (D3), 4 (D4), 5 (D5), and 6 d (D6) of darkness. Untreated leaves on the plant were used as a control (L6). Relative pixel densities for RBCL and RBCS are shown below the gel image. For each plant line, pixel density is normalized to the L6 control.

References

    1. Atkinson G.C., Tenson T., Hauryliuk V. (2011). The RelA/SpoT homolog (RSH) superfamily: distribution and functional evolution of ppGpp synthetases and hydrolases across the tree of life. PLoS One 6: e23479. - PMC - PubMed
    1. Bang W.Y., Chen J., Jeong I.S., Kim S.W., Kim C.W., Jung H.S., Lee K.H., Kweon H.S., Yoko I., Shiina T., Bahk J.D. (2012). Functional characterization of ObgC in ribosome biogenesis during chloroplast development. Plant J. 71: 122–134. - PubMed
    1. Battesti A., Bouveret E. (2006). Acyl carrier protein/SpoT interaction, the switch linking SpoT-dependent stress response to fatty acid metabolism. Mol. Microbiol. 62: 1048–1063. - PubMed
    1. Belgio E., Johnson M.P., Jurić S., Ruban A.V. (2012). Higher plant photosystem II light-harvesting antenna, not the reaction center, determines the excited-state lifetime-both the maximum and the nonphotochemically quenched. Biophys. J. 102: 2761–2771. - PMC - PubMed
    1. Börner T., Aleynikova A.Y., Zubo Y.O., Kusnetsov V.V. (2015). Chloroplast RNA polymerases: Role in chloroplast biogenesis. Biochim. Biophys. Acta 1847: 761–769. - PubMed

Publication types

LinkOut - more resources