. 2016 Mar 8;113(10):2702-7.
doi: 10.1073/pnas.1520112113. Epub 2016 Feb 23.

CXCL13 is a plasma biomarker of germinal center activity

Collaborators, Affiliations

CXCL13 is a plasma biomarker of germinal center activity

Colin Havenar-Daughton et al. Proc Natl Acad Sci U S A. .

Abstract

Significantly higher levels of plasma CXCL13 [chemokine (C-X-C motif) ligand 13] were associated with the generation of broadly neutralizing antibodies (bnAbs) against HIV in a large longitudinal cohort of HIV-infected individuals. Germinal centers (GCs) perform the remarkable task of optimizing B-cell Ab responses. GCs are required for almost all B-cell receptor affinity maturation and will be a critical parameter to monitor if HIV bnAbs are to be induced by vaccination. However, lymphoid tissue is rarely available from immunized humans, making the monitoring of GC activity by direct assessment of GC B cells and germinal center CD4(+) T follicular helper (GC Tfh) cells problematic. The CXCL13-CXCR5 [chemokine (C-X-C motif) receptor 5] chemokine axis plays a central role in organizing both B-cell follicles and GCs. Because GC Tfh cells can produce CXCL13, we explored the potential use of CXCL13 as a blood biomarker to indicate GC activity. In a series of studies, we found that plasma CXCL13 levels correlated with GC activity in draining lymph nodes of immunized mice, immunized macaques, and HIV-infected humans. Furthermore, plasma CXCL13 levels in immunized humans correlated with the magnitude of Ab responses and the frequency of ICOS(+) (inducible T-cell costimulator) Tfh-like cells in blood. Together, these findings support the potential use of CXCL13 as a plasma biomarker of GC activity in human vaccine trials and other clinical settings.

Keywords: CXCL13; HIV; Tfh; antibodies; vaccines.


Conflict of interest statement

The authors declare no conflict of interest.

Figures

Fig. 1.
Fig. 1.
Plasma CXCL13 concentration is associated with HIV bnAb development. (A) HIV neutralizers grouped by neutralization score for IAVI Protocol C. The neutralization score is derived from both breadth and potency data from a 6- or 37-virus cross-clade pseudovirus panel. (B) Plasma CXCL13 from top (neutralization score >1.0) and low (neutralization score <0.5) neutralizing individuals at the earliest time point available after infection (range of 1–9 mo; mean of 4 mo). (C) Plasma CXCL13 from top and low neutralizing individuals at the time of bnAb generation (range of 24–54 mo; mean of 40 mo). CXCL13 ELISA limit of detection (LOD) was 8 pg/mL. Means and interquartile ranges are shown in B and C. Each point represents an individual.
Fig. 2.
Fig. 2.
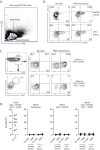
Human GC Tfh cells produce CXCL13 and correlate with plasma CXCL13. (A, Left) Identification of GC Tfh cells as PD-1hi CXCR5hi (gated on CD4+CD3+) T cells in human tonsil. (A, Center and Right) Intracellular cytokine staining for CXCL13 in unstimulated GC Tfh cells and all other non-GC Tfh CD4+ T cells in human tonsil. (B) Intracellular cytokine staining for CXCL13 in unstimulated cell subsets from nine human tonsils. (C) Intracellular cytokine staining for CXCL13 in unstimulated GC Tfh cells in human spleen (representative of two analyzed) and a human lymph node. (D) Identification of GC Tfh cells as PD-1hi CXCR5hi (gated on CD4+CD3+) T cells in human inguinal lymph node. (E) Matched plasma CXCL13 and lymph node GC Tfh cells in 14 human donors. Black indicates HIV+ antiretroviral-treated, blue indicates HIV seronegative, and red indicates HIV+ viremic controller. The Spearman r and P values are shown. The GC Tfh-cell percentage is plotted on log scale for visualization purposes only; the linear correlation results in an r2 value of 0.48. LN, lymph node.
Fig. S1.
Fig. S1.
Lack of CXCL13 production by blood monocytes and blood CXCR5+ CD4 T cells. (A) Monocyte gate by size [FSC (forward scatter)] and granularity [SSC (side scatter)] characteristics within human PBMCs. (B) Monocyte gated events from healthy donors or HIV+ individuals were either left unstimulated or stimulated for 4 h with PMA (phorbol 12-myristate 13-acetate) and Ionomycin in the presence of brefeldin A. Blood monocytes from both healthy and HIV+ donors produced TNF but did not produce CXCL13. (C, Upper) CD4+CXCR5+ gated or (C, Lower) CD4+CXCR5+PD1+++ICOS+ gated blood cells were either left unstimulated or stimulated for 4 h with PMA and Ionomycin in the presence of brefeldin A. Both cell populations expressed CD40L after stimulation but did not produce CXCL13 in either condition. (D) Frequency summary of CXCL13 producing cells from blood. Three healthy donor and three HIV+ donor samples were tested. GC Tfh cells from tonsil (from Fig. 2B) are included for comparison.
Fig. S2.
Fig. S2.
Plasma CXCL13 is correlated with GC B-cell frequency. (A) Human GC B cells as CD38+IgD (gated on CD19+) B cells in human inguinal lymph node were matched with plasma CXCL13 samples in 14 human donors. Samples are color coded as in Fig. 2E: black, HIV+ antiretroviral-treated; blue, HIV seronegative; red, HIV+ viremic controller. The Spearman r and P values are shown. The GC B-cell percentage is plotted on log scale for visualization purposes only; the linear correlation results in an r2 value of 0.25. This panel corresponds to the GC Tfh-cell–CXCL13 correlation shown in Fig. 2E. (B) Correlation of plasma CXCL13 and GC B cells (Bcl6+B220+) in naïve and alum + OVA immunized mice in Fig. 3C. GC B cells in naïve mice were set at the limit of detection (0.1% of total CD19+ B cells). (C) Nonsignificant positive correlation of plasma CXCL13 and GC B cells (Ki67+Bcl6+CD20+) in the draining popliteal lymph node of macaques 7 d after the second or third protein and adjuvant immunization. Aluminum hydroxide or TLR (Toll-like receptor) ligand-encapsulated PLGA [poly(lactic-co-glycolic acid)] nanoparticles were used as adjuvants for gp140 Env and p55 Gag recombinant SIV (Simian immunodeficiency virus) proteins. This panel corresponds to the GC Tfh-cell–CXCL13 correlation shown in Fig. 4C.
Fig. 3.
Fig. 3.
Plasma CXCL13 correlates with GC Tfh cells in mice after immunization. (A) Plasma CXCL13 in naïve mice or mice 7 d after alum + NP-OVA footpad immunization, LCMV infection, or vaccinia virus infection. Black circles indicate the presence of transferred CD4+ TCR transgenic T cells: OT-II cells into the alum + NP-OVA group and NIP cells into the LCMV group. White circles indicate untransferred mice. (B) Identification of GC Tfh cells as PD-1hi CXCR5hi cells in the draining popliteal lymph node of an NP-OVA immunized mouse. (C) Correlation of plasma CXCL13 and GC Tfh cells in naïve and alum + NP-OVA immunized mice from A. GC Tfh cells in naïve mice were set at the limit of detection (0.1% of the total CD4+ T cells). (D and E) Plasma CXCL13 in B6 mice immunized in the footpad with KLH + alum. Data representative of two experiments of 10 mice each. (D) Plasma CXCL13 pre- and postprimary immunization. (E) Plasma CXCL13 in the same mice as those in D after a boost with KLH + alum at 50 d postprimary immunization. (F) Correlation of plasma CXCL13 and GC Tfh cells in the draining popliteal lymph node at 10 and 18 d postboost from animals shown in E. CXCL13 is plotted as fold change of day 10 or 18 postbooster immunization over preboost (d50) CXCL13 concentration.
Fig. 4.
Fig. 4.
Plasma CXCL13 correlates with GC Tfh cells in rhesus macaques after immunization. (A) Identification and characterization of GC Tfh cells (PD1hi CXCR5hi CD4+ T cells) in lymph node from rhesus macaques. Expression of Bcl-6, ICOS, and CD200 is shown for GC Tfh cells (red), mantle CXCR5+ Tfh cells (blue), and non-Tfh cells (gray). (B) Identification of (Left) GC Tfh cells and (Right) GC B cells (identified as Ki67+Bcl6+ cells; gated on CD20+ cells) in nondraining (axillary) and draining lymph nodes (popliteal) of macaques 7 d after protein and adjuvant immunization in the leg. (C) Correlation of plasma CXCL13 and GC Tfh cells in the draining popliteal lymph node of macaques 7 d after the second or third protein and adjuvant immunization. The correlation holds even with removal of the potential outlier point (highest GC Tfh cell and highest CXCL13), with values of r = 0.62 and P = 0.048. Aluminum hydroxide or TLR (Toll-like receptor) ligand-encapsulated PLGA [poly(lactic-co-glycolic acid)] nanoparticles were used as adjuvants for gp140 Env and p55 Gag recombinant SIV (Simian immunodeficiency virus) proteins. All data are representative of two similar immunization experiments in rhesus macaques totaling 22 animals. LN, lymph node.
Fig. S3.
Fig. S3.
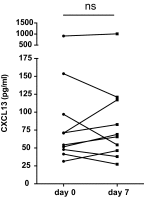
Plasma CXCL13 is not significantly increased after influenza immunization in humans. Plasma CXCL13 measured before immunization (day 0) and 7 d postinfluenza vaccination in 10 individuals. Healthy donors were enrolled in an influenza vaccine study at the Stanford–Lucile Packard Children’s Hospital Vaccine Program during the 2010–2011 influenza season and received a single dose of TIV Fluzone (Sanofi Pasteur). ns, not significant.
Fig. 5.
Fig. 5.
Plasma CXCL13 is increased after immunization in humans. (A) Plasma CXCL13 measured before immunization (day 0) and 7 d postyellow fever vaccination in 17 individuals. (B–D) HVTN068 participants who received an Ad5/vector encoding HIV gag and envelope immunization 6 mo postprime. (B) Kinetic analysis of plasma CXCL13 post-Ad5/HIV boost. Plasma CXCL13 was measured in 11 vaccinated individuals. (C) Correlation of plasma CXCL13 7 d postimmunization and anti-gp41 Env Ab responses (ELISA OD) 4 wk postimmunization in 26 vaccinated individuals. Anti-gp41 Ab ELISA OD is background-subtracted. (D) Correlation of plasma CXCL13 7 d postimmunization and the fold change of ICOS+ blood Tfh-like cells (percentage at day 7 postboost over percentage at preboost time point) in six vaccinated donors. LOD, limit of detection; OD, optical density.
Fig. S4.
Fig. S4.
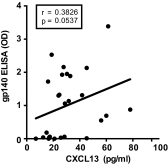
Correlation of plasma CXCL13 concentration and Ab response after immunization. As in Fig. 5C except plasma CXCL13 concentration 7 d postimmunization correlated with anti-gp140 (ConS; consensus group M) Env Ab responses (ELISA OD) 4 wk postimmunization in 26 vaccinated individuals (HVTN068). Anti-gp140 Ab ELISA OD is background-subtracted.

References

    1. Victora GD, Nussenzweig MC. Germinal centers. Annu Rev Immunol. 2012;30:429–457. - PubMed
    1. Haynes BF, et al. Progress in HIV-1 vaccine development. J Allergy Clin Immunol. 2014;134(1):3–10. - PMC - PubMed
    1. Burton DR, Mascola JR. Antibody responses to envelope glycoproteins in HIV-1 infection. Nat Immunol. 2015;16(6):571–576. - PMC - PubMed
    1. Sok D, et al. The effects of somatic hypermutation on neutralization and binding in the PGT121 family of broadly neutralizing HIV antibodies. PLoS Pathog. 2013;9(11):e1003754. - PMC - PubMed
    1. Klein F, et al. Somatic mutations of the immunoglobulin framework are generally required for broad and potent HIV-1 neutralization. Cell. 2013;153(1):126–138. - PMC - PubMed

Publication types