

Quantitative Assessment of Heart Rate Dynamics during Meditation: An ECG Based Study with Multi-Fractality and Visibility Graph
- PMID: 26909045
- PMCID: PMC4754439
- DOI: 10.3389/fphys.2016.00044
Quantitative Assessment of Heart Rate Dynamics during Meditation: An ECG Based Study with Multi-Fractality and Visibility Graph
Abstract
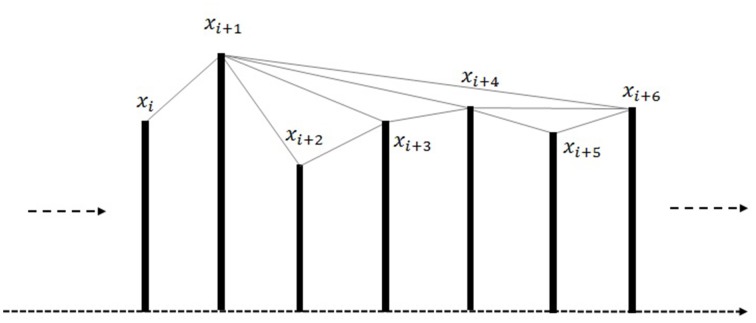
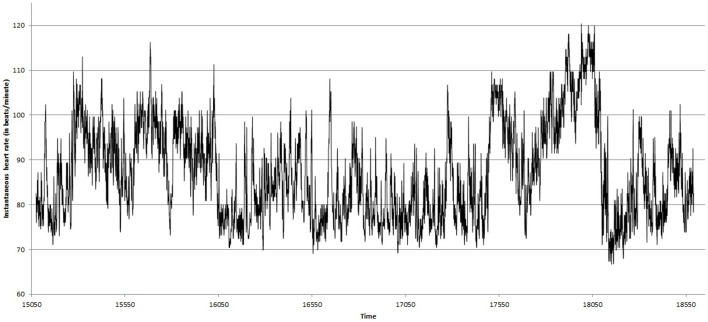
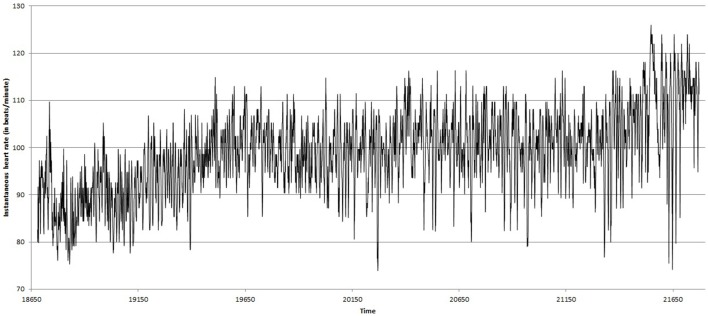
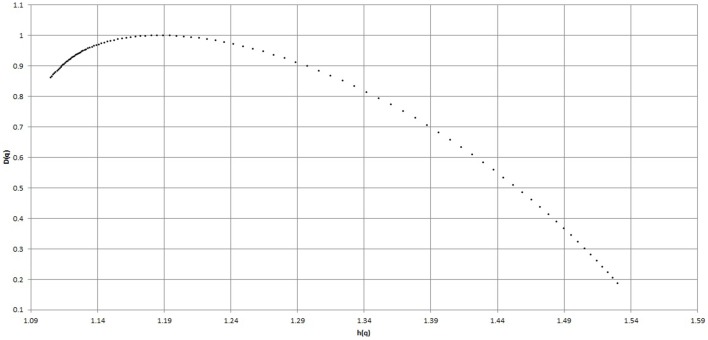
The cardiac dynamics during meditation is explored quantitatively with two chaos-based non-linear techniques viz. multi-fractal detrended fluctuation analysis and visibility network analysis techniques. The data used are the instantaneous heart rate (in beats/minute) of subjects performing Kundalini Yoga and Chi meditation from PhysioNet. The results show consistent differences between the quantitative parameters obtained by both the analysis techniques. This indicates an interesting phenomenon of change in the complexity of the cardiac dynamics during meditation supported with quantitative parameters. The results also produce a preliminary evidence that these techniques can be used as a measure of physiological impact on subjects performing meditation.
Keywords: ECG; MF-DFA; fractal; meditation; visibility graph.
Figures
References
-
- Ahmadloua M., Adelic H., Adelid A. (2012). Improved visibility graph fractality with application for the diagnosis of autism spectrum disorder. Phys. A Stat. Mech. Appl. 391, 4720–4726. 10.1016/j.physa.2012.04.025 - DOI
-
- Austin J. H. (1998). Zen and the Brain. Cambridge, MA: MIT Press.
LinkOut - more resources
Full Text Sources
Other Literature Sources