. 2016 Jan 20;3(1):140536.
doi: 10.1098/rsos.140536. eCollection 2016 Jan.

Improved community detection in weighted bipartite networks

Affiliations

Improved community detection in weighted bipartite networks

Stephen J Beckett. R Soc Open Sci. .

Abstract

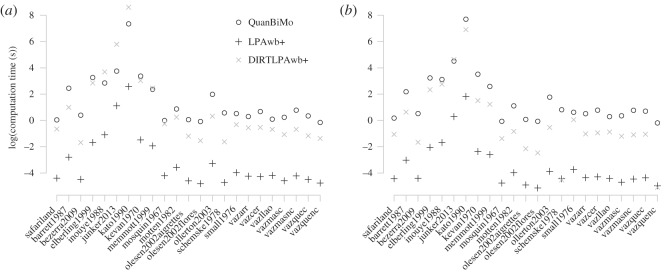
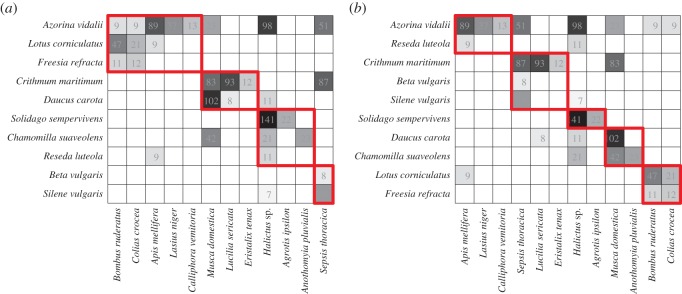
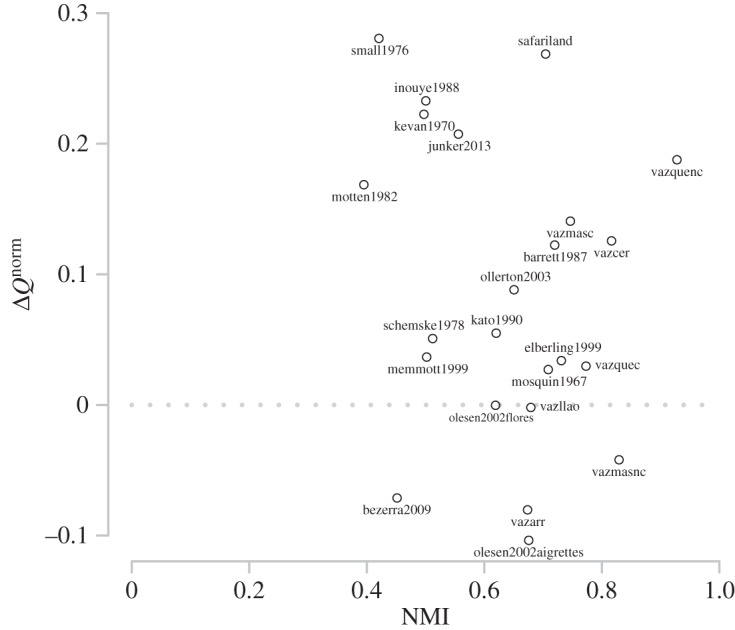
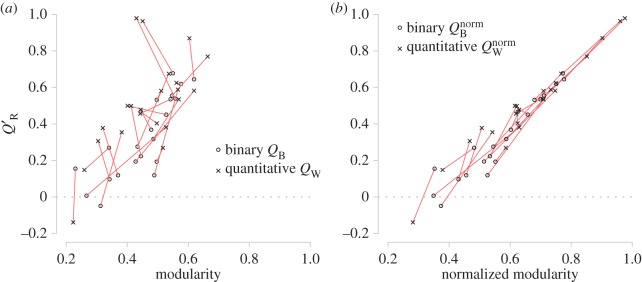
Real-world complex networks are composed of non-random quantitative interactions. Identifying communities of nodes that tend to interact more with each other than the network as a whole is a key research focus across multiple disciplines, yet many community detection algorithms only use information about the presence or absence of interactions between nodes. Weighted modularity is a potential method for evaluating the quality of community partitions in quantitative networks. In this framework, the optimal community partition of a network can be found by searching for the partition that maximizes modularity. Attempting to find the partition that maximizes modularity is a computationally hard problem requiring the use of algorithms. QuanBiMo is an algorithm that has been proposed to maximize weighted modularity in bipartite networks. This paper introduces two new algorithms, LPAwb+ and DIRTLPAwb+, for maximizing weighted modularity in bipartite networks. LPAwb+ and DIRTLPAwb+ robustly identify partitions with high modularity scores. DIRTLPAwb+ consistently matched or outperformed QuanBiMo, while the speed of LPAwb+ makes it an attractive choice for detecting the modularity of larger networks. Searching for modules using weighted data (rather than binary data) provides a different and potentially insightful method for evaluating network partitions.

Keywords: bipartite networks; modular structure; modules; network ecology.


Figures

Figure 1.
Figure 1.
(a) The olesen2002flores bipartite network of 12 species of pollinators (blue nodes (top)) visiting 10 plant species (red nodes (bottom)). The width of the edges linking the nodes represents the number of pollinator–plant visitations, while the width of the nodes represents the marginal total of visits made by a pollinator species or received by a plant species.(b) The same network represented by the incidence matrix denoted A~ in the text, where the plant species are represented as rows and the pollinator species as columns and the presence of visitations between a pollinator and plant species is represented by a 1. (c) The incidence matrix A~ is the binary equivalent of W~, the weighted interaction matrix shown here. The cell numbers correspond to the number of observed pollinator–plant visitations that occurred (where there is no number in a square there were 0 visitations).
Figure 2.
Figure 2.
Evaluation of the LPAwb+ and DIRTLPAwb+ algorithms against synthetically generated weighted networks with known modular structure for given levels of noise. Panel (a) shows the ratio of detected modules to known modules, and (b) shows the ratio of detected modularity (QW) to the modularity of the implanted structure. The dotted lines represent the ability to perfectly detect the synthetic community partitions. Finally, (c) shows the NMI between detected community structure and the embedded community structure.
Figure 3.
Figure 3.
Comparing the maximum detected modularity scores by each algorithm (from 100 repetitions on each of the 23 plant–pollinator networks). The dotted line indicates a consensus, i.e. QuanBiMo and the other algorithms are in perfect correspondence. Points below the dotted line indicate QuanBiMo maximizes modularity more effectively; while points above the dotted line show that LPAwb+ or DIRTLPAwb+ detected partitions with greater modularity than QuanBiMo. Panel (a) shows a comparison of binary modularity scores, QB, while (b) shows the weighted modularity scores, QW.
Figure 4.
Figure 4.
Comparison of median modularity scores found by each algorithm (from 100 repetitions on each of the 23 plant–pollinator networks) to the maximum of the modularity scores found across the algorithms—the consensus maximum modularity. Panel (a) shows results for binary networks, while (b) shows the results for weighted networks. The dotted line represents algorithm efficacy, where median modularity score is equal to the maximum consensus modularity score that was detected.
Figure 5.
Figure 5.
Average computational time for each algorithm (measured over 100 replicates) on the (a) binary and (b) quantitative representations of each plant–pollinator network.
Figure 6.
Figure 6.
A visual comparison of the modular structures identified for the olesen2002flores dataset of plant–pollinator visitations as a (a) binary (QB=0.444, four modules, QnormB=0.625) and (b) quantitative (QW=0.497 , five modules, QWnorm=0.625) network. Modulesare identified in red. The NMI shared between these two modular compositions is NMI=0.619 indicating a qualitative difference in the revealed modular structure.
Figure 7.
Figure 7.
The change in normalized modularity scores found between the weighted and binary networks (ΔQnorm=QWnormQBnorm) against the NMI between the weighted and binary partitions for each network.
Figure 8.
Figure 8.
(a) The greatest modularity scores (QB and QW) for each network and their corresponding realized modularity scores (QR). (b) The normalized modularity scores (QnormB and QnormW) calculated using the partitions with greatest modularity scores plotted against their corresponding realized modularity scores. Each red line joins together the binary and quantitative scores of the same network.

References

    1. Newman M. 2010. Networks: an introduction. Oxford, UK: Oxford University Press.
    1. Newman ME, Watts DJ, Strogatz SH. 2002. Random graph models of social networks. Proc. Natl Acad. Sci. USA 99, 2566–2572. (doi:10.1073/pnas.012582999) - DOI - PMC - PubMed
    1. Saavedra S, Stouffer DB, Uzzi B, Bascompte J. 2011. Strong contributors to network persistence are the most vulnerable to extinction. Nature 478, 233–235. (doi:10.1038/nature10433) - DOI - PubMed
    1. Olesen JM, Bascompte J, Dupont YL, Jordano P. 2007. The modularity of pollination networks. Proc. Natl Acad. Sci. USA 104, 19891–19896. (doi:10.1073/pnas.0706375104) - DOI - PMC - PubMed
    1. Fortunato S. 2010. Community detection in graphs. Phys. Rep. 486, 175–174 (doi:10.1016/j.physrep.2009.11.002) - DOI

LinkOut - more resources