. 2015 Nov 26;5(2):67-78.
doi: 10.1016/j.molmet.2015.11.004. eCollection 2016 Feb.

Ataxin-10 is part of a cachexokine cocktail triggering cardiac metabolic dysfunction in cancer cachexia

Affiliations

Ataxin-10 is part of a cachexokine cocktail triggering cardiac metabolic dysfunction in cancer cachexia

Michaela Schäfer et al. Mol Metab. .

Erratum in

Abstract

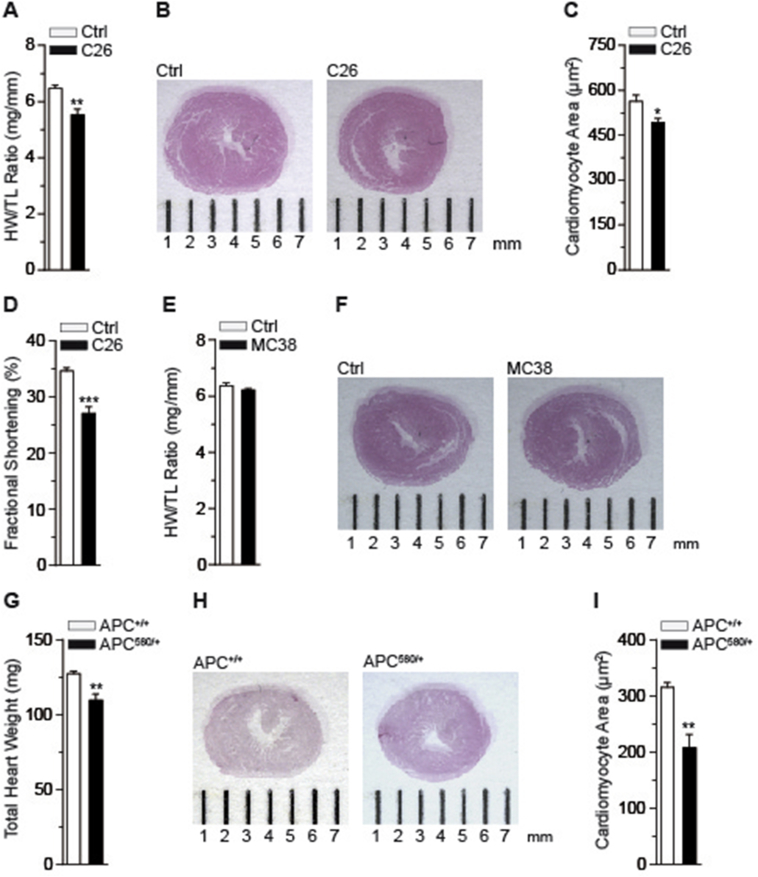
Objectives: Cancer cachexia affects the majority of tumor patients and significantly contributes to high mortality rates in these subjects. Despite its clinical importance, the identity of tumor-borne signals and their impact on specific peripheral organ systems, particularly the heart, remain mostly unknown.

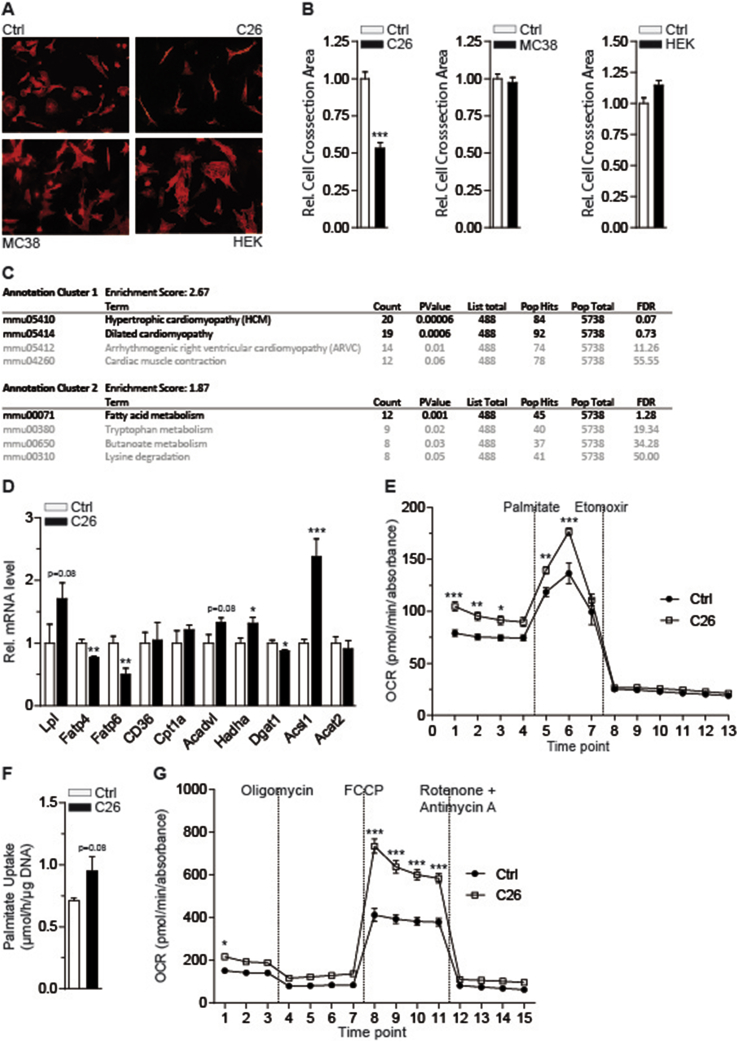
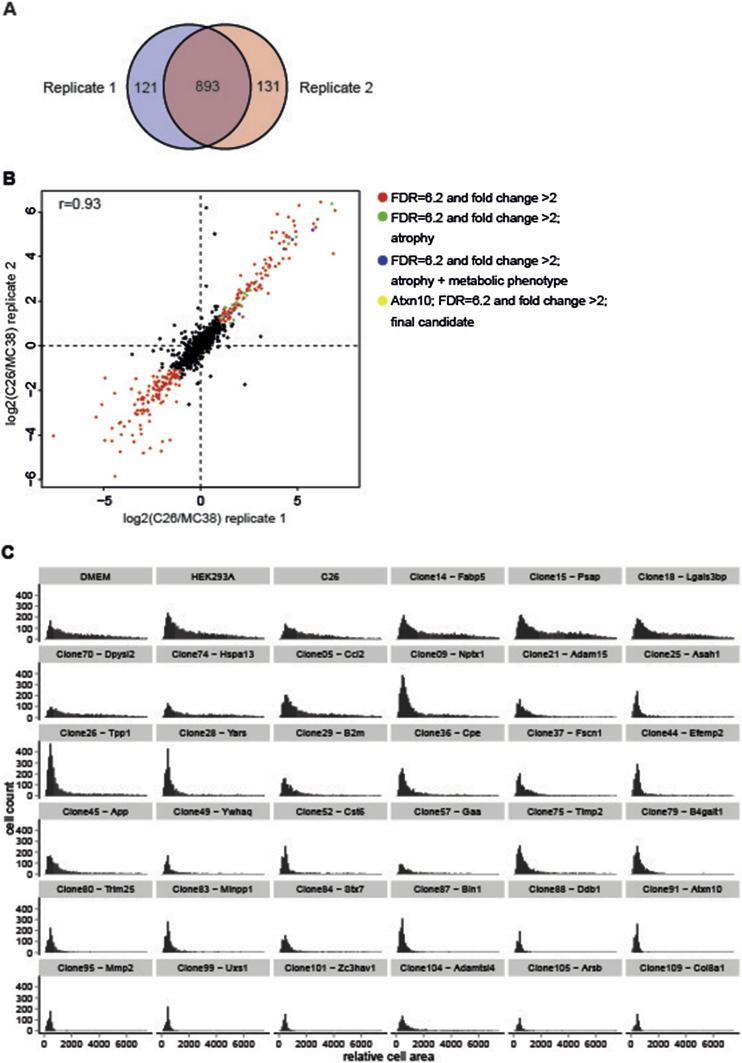
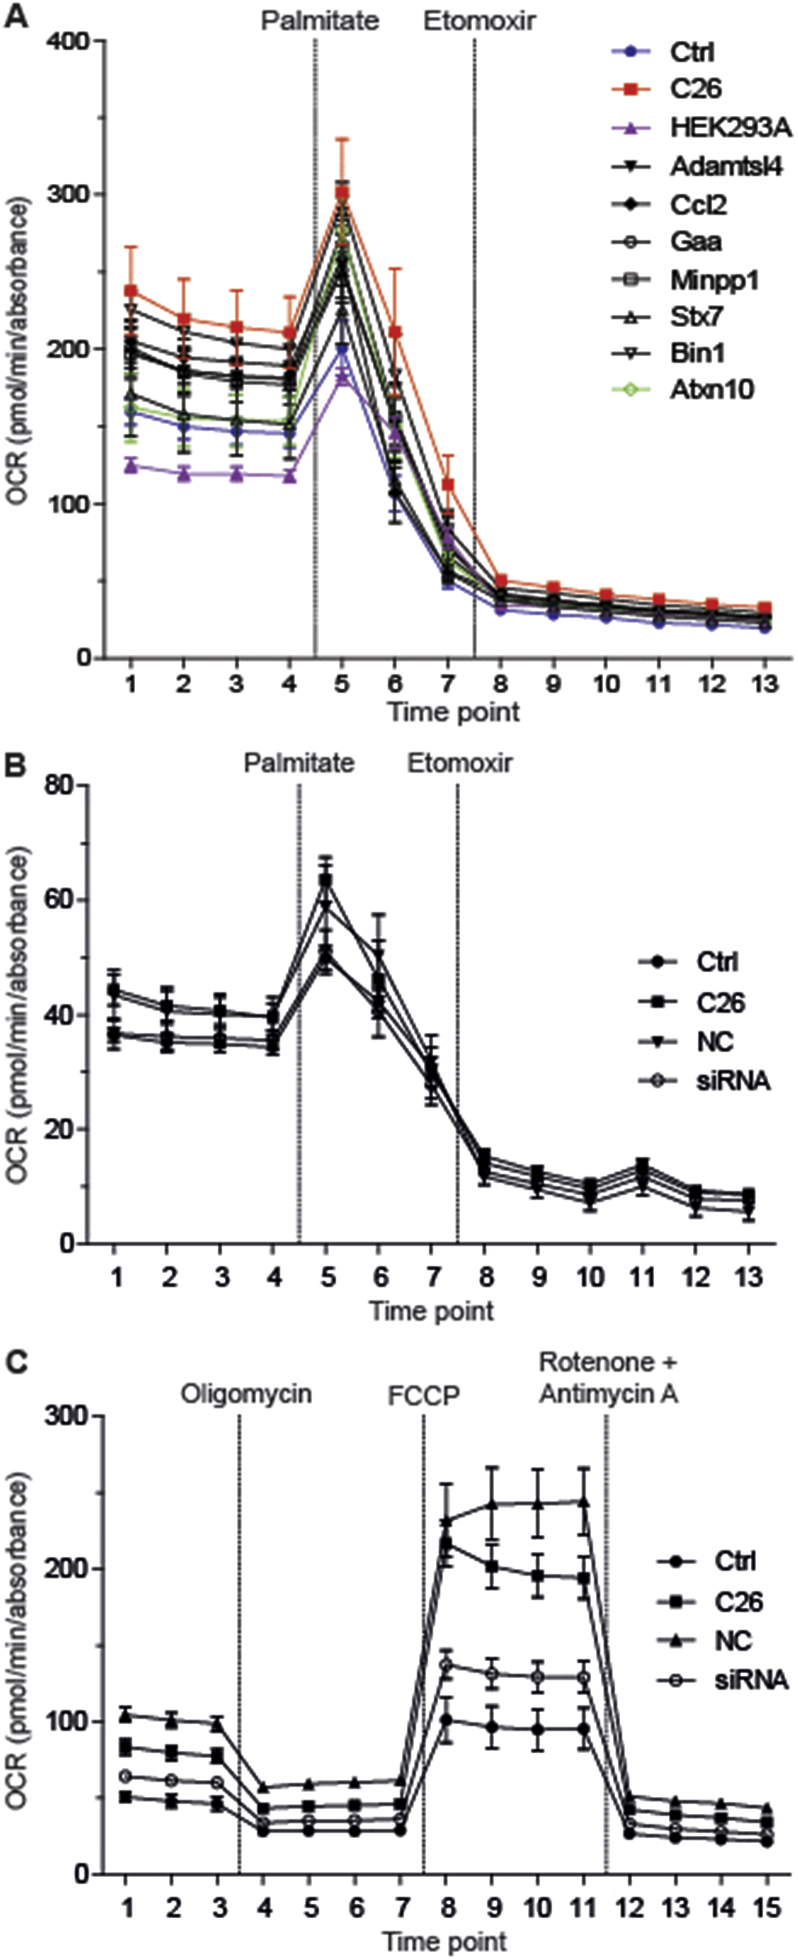
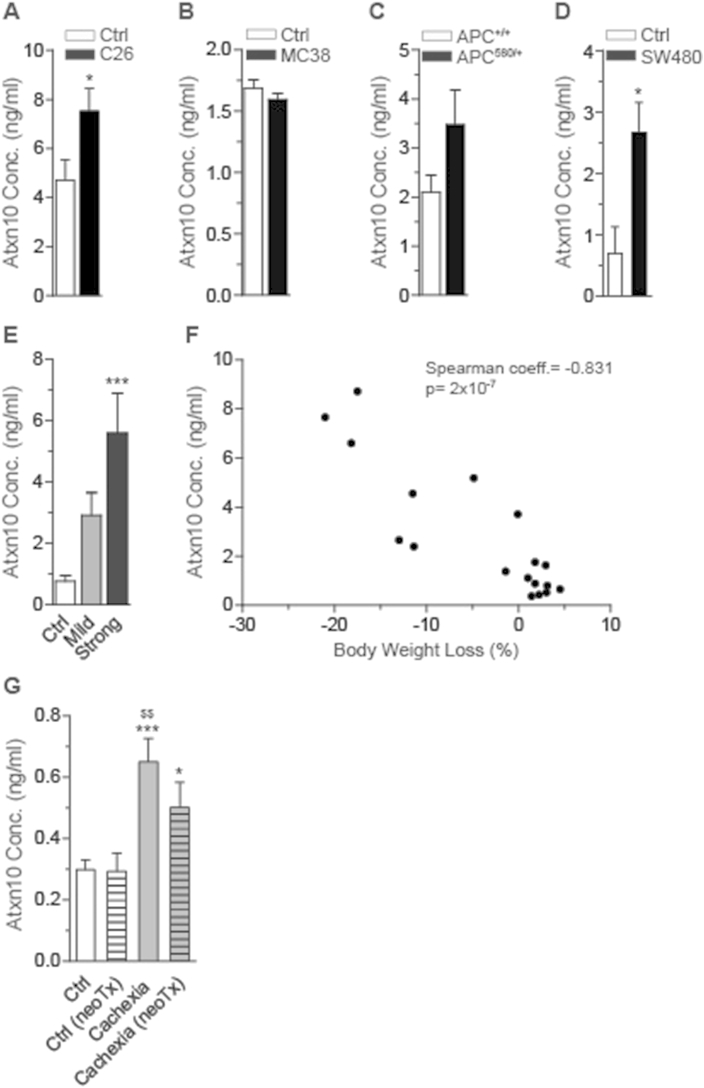
Methods and results: By combining differential colon cancer cell secretome profiling with large-scale cardiomyocyte phenotyping, we identified a signature panel of seven "cachexokines", including Bridging integrator 1, Syntaxin 7, Multiple inositol-polyphosphate phosphatase 1, Glucosidase alpha acid, Chemokine ligand 2, Adamts like 4, and Ataxin-10, which were both sufficient and necessary to trigger cardiac atrophy and aberrant fatty acid metabolism in cardiomyocytes. As a prototypical example, engineered secretion of Ataxin-10 from non-cachexia-inducing cells was sufficient to induce cachexia phenotypes in cardiomyocytes, correlating with elevated Ataxin-10 serum levels in murine and human cancer cachexia models.

Conclusions: As Ataxin-10 serum levels were also found to be elevated in human cachectic cancer patients, the identification of Ataxin-10 as part of a cachexokine cocktail now provides a rational approach towards personalized predictive, diagnostic and therapeutic measures in cancer cachexia.

Keywords: Ataxin-10; Cancer cachexia; Cardiac dysfunction; Fatty acid metabolism.


Figures

Figure 1
Figure 1
Cancer cachexia induces remodeling of the heart (A) Heart weight (HW)/tibia length (TL) ratio for control (Ctrl) and C26 bearing mice (C26) (n = 6 animals in Ctrl group, n = 10 animals in C26 group). (B) Representative overview images of H&E stained heart cross-sections of a control (Ctrl) and a C26 bearing mouse (C26). (C) Quantification of cardiomyocyte cross-sectional areas for control (Ctrl) and C26 bearing mice (C26) (n ≥ 100 cardiomyocytes per heart; n = 5 hearts per group). (D) Fractional shortening (FS) for control (Ctrl) and C26 bearing mice (C26) determined by using Vevo 2100 (n = 6 animals in Ctrl group, n = 10 animals in C26 group). (A)–(D) Mice were sacrificed on day 21 post PBS (Ctrl) and C26 cell injection. (E) Heart weight (HW)/tibia length (TL) ratio for control (Ctrl) and MC38 carrying mice (MC38) (n = 8 animals in Ctrl group, n = 10 animals in MC38 group). (F) Representative overview images of H&E stained heart cross-sections of a control (Ctrl) and a MC38 bearing mouse (MC38). (G) Total heart weight (HW) of wild-type (APC+/+) and APC delta 580 (APC580/+) mice (n = 6 animals in APC+/+ group, n = 8 animals in APC580/+ group). (H) Representative overview images of H&E stained heart cross-sections of a wild-type (APC+/+) and an APC delta 580 (APC580/+) mouse. (I) Quantification of cardiomyocyte cross-sectional areas of wild-type (APC+/+) and APC delta 580 (APC580/+) mice (n ≥ 100 cardiomyocytes per heart; n = 4 hearts per group). (A), (C), (D), (E), (G) and (I) Data are means ± SEM. *indicates significance using Student's t-test with Welch correction, *p < 0.05, **p < 0.01, ***p < 0.001.
Figure 2
Figure 2
Tumor-borne secreted factors mediate cardiomyocyte atrophy and alter cardiomyocyte fatty acid metabolism. (A) Immunofluorescence staining of α-actinin in neonatal rat cardiomyocytes cultured in standard medium (Ctrl) or conditioned medium from C26, MC38 and HEK293A cells for 24 h, respectively (Magnification: 20×). (B) Relative cross-sectional areas of neonatal rat cardiomyocytes of the experiment shown in (A) (n ≥ 100 cardiomyocytes per condition). (C) Top hits (black) of KEGG pathway analysis of genes differentially regulated in primary adult mouse cardiomyocytes after treatment with conditioned medium from C26 cells for 48 h (n = 3 cell culture wells per group). (D) Relative mRNA level of lipoprotein lipase (Lpl), fatty acid transporter 4 (Fatp4), fatty acid transporter 6 (Fatp6), fatty acid translocase (FAT/CD36), carnitine palmitoyltransferase 1a (Cpt1a), acyl-CoA dehydrogenase, very long chain (Acadvl), hydroxyacyl-CoA dehydrogenase/3-ketoacyl-CoA thiolase/enoyl-CoA hydratase (Hadha), diglyceride acyltransferase 1 (Dgat1), acyl-CoA synthetase long-chain family member 1 (Acsl1) and acetyl-CoA acetyltransferase 2 (Acat2) in neonatal rat cardiomyocytes cultured in standard medium (Ctrl) or conditioned medium from C26 cells (n = 4 cell culture wells per group). (E) Palmitate-driven oxidation of neonatal rat cardiomyocytes cultured in standard medium (Ctrl) or C26 conditioned medium for 24 h (n = 9 cell culture wells for Ctrl group, n = 15 cell culture wells for C26 group). Mitochondrial function is expressed by oxygen consumption rate (OCR; means ± SEM). 1 mM BSA-conjugated palmitate and 1 mM etomoxir were added at the indicated time points. (F) Uptake of 3H labeled palmitate by neonatal rat cardiomyocytes cultured in standard medium (Ctrl) or C26 conditioned medium (C26) for 24 h (n = 6 cell culture wells per group). (G) MitoStress testing of neonatal rat cardiomyocytes cultured in standard medium (Ctrl) or C26 conditioned medium (C26) for 24 h (n = 10 cell culture wells for Ctrl group, n = 15 cell culture wells for C26 group). Mitochondrial function is expressed by oxygen consumption rate (OCR; means ± SEM). 2 μM oligomycin, 0.3 μM FCCP and 1 μM rotenone together with 1 μM antimycin A were added at the indicated time points. (B), (D) and (F) Data are means ± SEM. *indicates significance using Student's t-test with Welch correction, *p < 0.05, **p < 0.01, ***p < 0.001. (E) and (G) Data are means ± SEM. *indicates significance using 2-way ANOVA, Bonferroni post-test, *p < 0.05, **p < 0.01, ***p < 0.001.
Figure 3
Figure 3
Quantification of pro-cachectic factors and analysis of their atrophy-inducing potential. (A) and (B) Quantification of secreted proteins comparing cachexia-inducing C26 cells and non-cachexia-inducing MC38 cells. (A) Number and overlap of proteins quantified in the two biological replicates. (B) Pearson correlation between the two biological replicates is 0.93. 271 of 893 proteins quantified in both replicates show significant differences between the two cell lines (red). 28 of the 129 proteins stronger secreted by C26 cells can induce atrophy (green, blue and yellow). 7 of these additionally induce a metabolic phenotype (blue and yellow). (C) Histogram of the 384-well high throughput screening showing the areas of neonatal rat cardiomyocytes cultured in standard medium (Ctrl), under non atrophy-inducing conditions (conditioned medium from untreated HEK293A cells and HEK293A cells + cDNA clone: 14 (Fabp5), 15 (Psap), 18 (Lgals3bp), 70 (Dpysl2) or 74 (Hspa13)) and under atrophy-inducing conditions (conditioned medium from C26 cells and HEK293A cells + cDNA Clone: 5 (Ccl2), 9 (Nptx1), 21 (Adam15), 25 (Asah1), 26 (Tpp1), 28 (Yars), 29 (B2m), 36 (Cpe), 37 (Fscn1), 44 (Efemp2), 45 (App), 49 (Ywhaq), 52 (Cst6), 57 (Gaa), 75 (Timp2), 79 (B4galt1), 80 (Trim25), 83 (Minpp1), 84 (Stx7), 87 (Bin1), 88 (Ddb1), 91 (Atxn10), 95 (Mmp2), 99 (Uxs1), 101 (Zc3hav1), 104 (Adamtsl4), 105 (Arsb) or 109 (Col8a1)). (n = 6–9 cell culture wells per condition).
Figure 4
Figure 4
Selective cachexokines provoke aberrant fatty acid metabolism in cardiomyocytes. (A) Palmitate-driven oxidation of neonatal rat cardiomyocytes cultured in standard medium (Ctrl), conditioned medium from C26 cells or HEK293A cells that were either untreated (HEK293A) or over-expressed one of the selective “cachexokines” (Adamts like 4 (Adamtsl4), Chemokine ligand 2 (Ccl2), Glucosidase alpha acid (Gaa), Multiple inositol-polyphosphate phosphatase 1 (Minpp1), Syntaxin 7 (Stx7), Bridging integrator 1 (Bin1) and Ataxin-10 (Atxn10)) for 24 h (n = 5 cell culture wells for Ctrl, C26, HEK293A, Gaa and Stx7 group, n = 6 cell culture wells for Adamtsl4, Ccl2, Minpp1, Bin1 and Atxn10 group). Mitochondrial function is expressed by oxygen consumption rate (OCR; means ± SEM). 1 mM BSA-conjugated palmitate and 1 mM etomoxir were added at the indicated time points. (B) Palmitate-driven oxidation of neonatal rat cardiomyocytes cultured in standard medium (Ctrl), conditioned medium from untreated C26 cells or C26 cells that were treated with either negative control (NC) siRNA or siRNAs directed against all 7 remaining candidates (siRNA) for 24 h (n = 7 cell culture wells for NC and siRNA group, n = 9 cell culture wells for Ctrl and C26 group). (C) MitoStress testing of neonatal rat cardiomyocytes cultured as described for (B) (n = 10 cell culture wells per group). Mitochondrial function is expressed by oxygen consumption rate (OCR; means ± SEM). 2 μM oligomycin, 0.3 μM FCCP and 1 μM rotenone together with 1 μM antimycin A were added at the indicated time points.
Figure 5
Figure 5
Serum Ataxin-10 levels are elevated under cachectic conditions. (A)–(D) Ataxin-10 (Atxn10) serum levels in different mouse models: (A) C26 (n = 6 animals in Ctrl group, n = 9 animals in C26 group), (B) MC38 (n = 3 animals in Ctrl group, n = 4 animals in MC38 group), (C) APC delta 580 (n = 5 animals in APC+/+ group, n = 6 animals in APC580/+ group) and (D) SW480 (n = 3 animals in Ctrl group, n = 6 animals in SW480 group). (E) Ataxin-10 (Atxn10) serum levels in wild-type mice (Ctrl) and mice with mild (mean body weight loss: 2.5%) and strong (mean body weight loss: 17%) cachectic phenotype that underwent orthotopic implantation of pancreatic cancer cells (n = 7 animals in Ctrl group, n = 6 animals in mild cachectic group, n = 5 animals in strong cachectic group). (F) Spearman correlation of Ataxin-10 (Atxn10) serum level and body weight loss (%) in the pancreatic orthotopic implantation mouse model (Coefficient (coeff.) = −0.831), p-value: 2 × 10−7). (G) Ataxin-10 (Atxn10) serum levels in pancreatic ductal adenocarcinoma patients (PDAC) without cachexia and neoadjuvant therapy (neoTx) (Ctrl), PDAC patients without cachexia but neoTx (Ctrl (neoTx)), PDAC patients with cachexia but without neoTx (Cachexia) and PDAC patients with cachexia and neoTx (Cachexia (neoTx)) (n = 24 patients in Ctrl group, n = 8 patients in Ctrl (neoTx) group, n = 10 patients in Cachexia group, n = 10 patients in Cachexia (neoTx) group). (A)(D) Data are means ± SEM. *indicates significance using Student's t-test with Welch correction, *p < 0.05. (E) Data are means ± SEM. *indicates significance using 1-way ANOVA, Bonferroni post-test, compared to Ctrl group, ***p < 0.001. (G) Data are means ± SEM. *indicates significance using 1-way ANOVA, Tukey's multiple comparison test, compared to Ctrl group, *p < 0.05, ***p < 0.001. $indicates significance using 1-way ANOVA, Tukey's multiple comparison test, compared to Ctrl (neoTx) group, $$p < 0.01.

References

    1. Fearon K., Arends J., Baracos V. Understanding the mechanisms and treatment options in cancer cachexia. Nature Reviews Clinical Oncology. 2013;10:90–99. - PubMed
    1. Springer J., Tschirner A., Haghikia A., von Haehling S., Lal H., Grzesiak A. Prevention of liver cancer cachexia-induced cardiac wasting and heart failure. European Heart Journal. 2014;35:932–941. - PMC - PubMed
    1. Dewys W.D., Begg C., Lavin P.T., Band P.R., Bennett J.M., Bertino J.R. Prognostic effect of weight loss prior to chemotherapy in cancer patients. Eastern Cooperative Oncology Group. American Journal of Medicine. 1980;69:491–497. - PubMed
    1. Tisdale M.J. Cachexia in cancer patients. Nature Reviews Cancer. 2002;2:862–871. - PubMed
    1. Martignoni M.E., Kunze P., Hildebrandt W., Kunzli B., Berberat P., Giese T. Role of mononuclear cells and inflammatory cytokines in pancreatic cancer-related cachexia. Clinical Cancer Research. 2005;11:5802–5808. - PubMed

LinkOut - more resources