. 2016 Mar 3;531(7592):110-3.
doi: 10.1038/nature16967. Epub 2016 Feb 24.

Mutant Kras copy number defines metabolic reprogramming and therapeutic susceptibilities

Affiliations

Mutant Kras copy number defines metabolic reprogramming and therapeutic susceptibilities

Emma M Kerr et al. Nature. .

Abstract

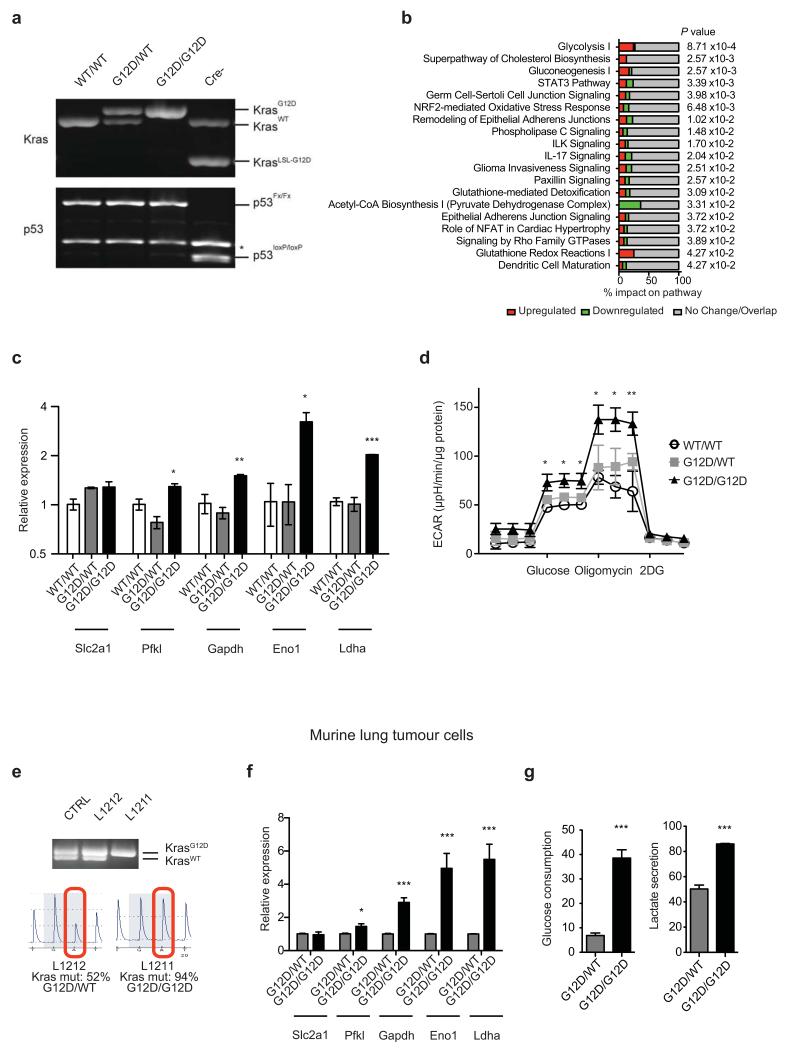
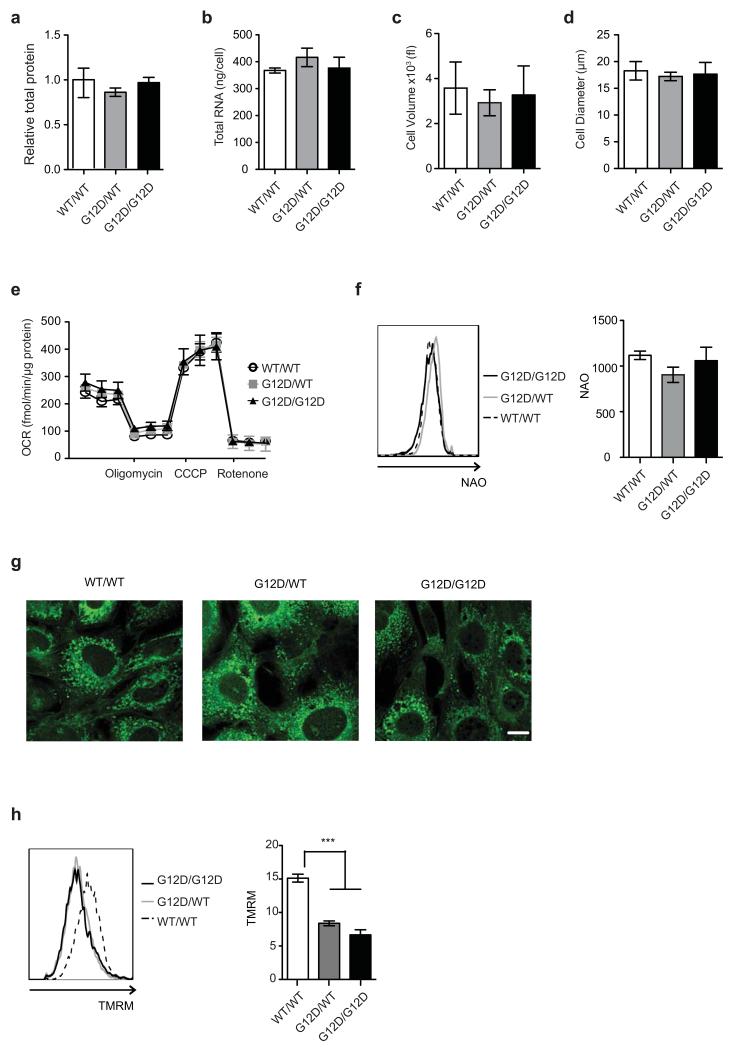
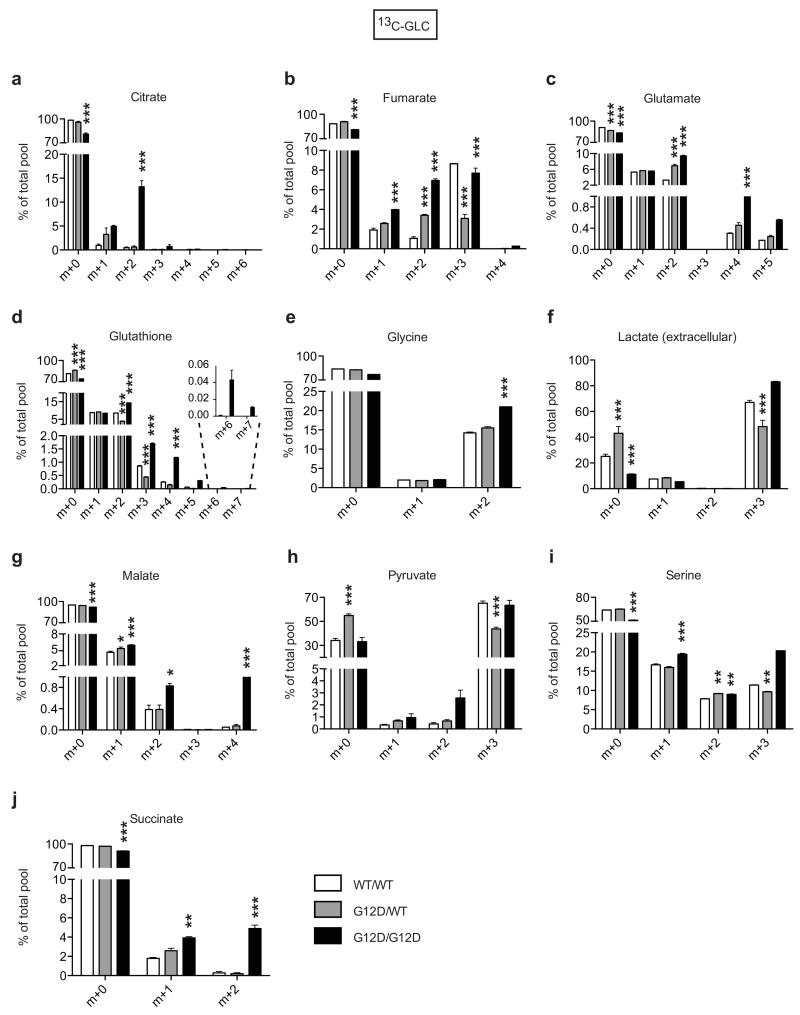
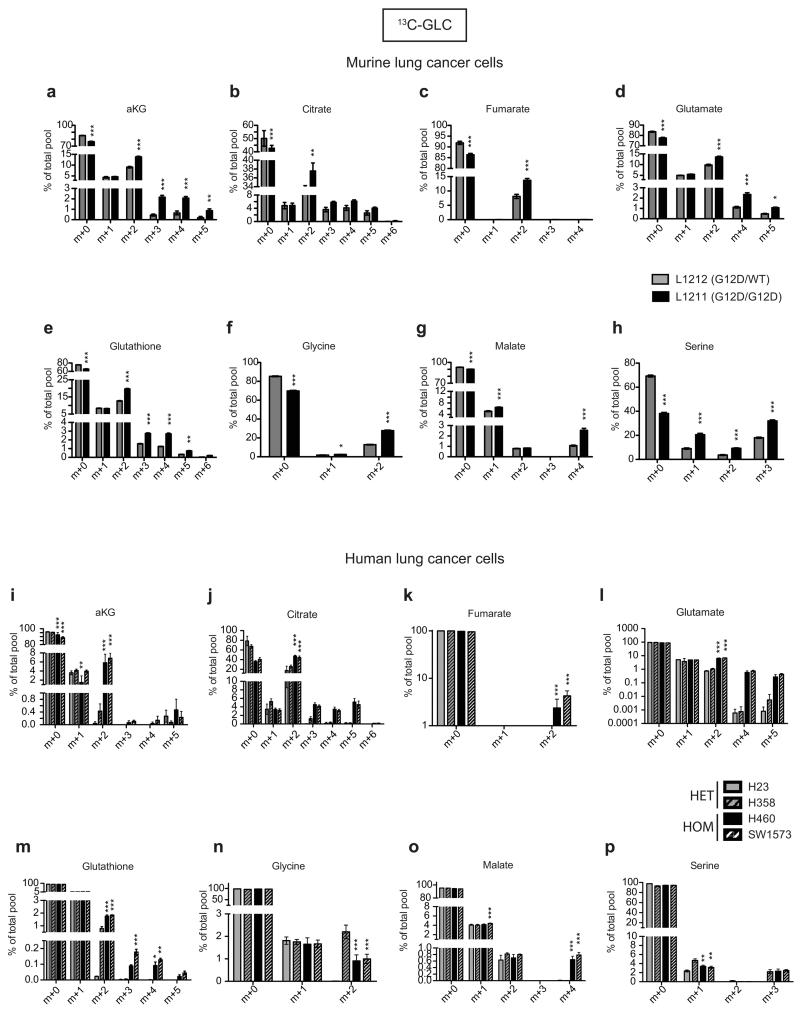
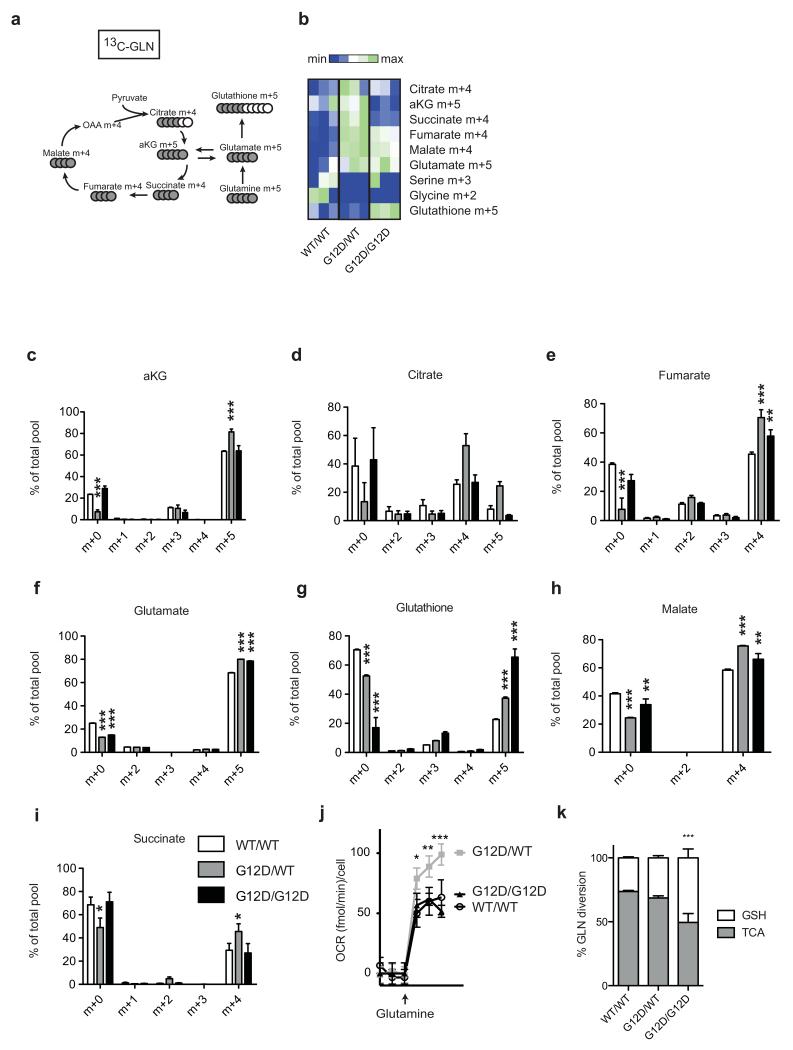
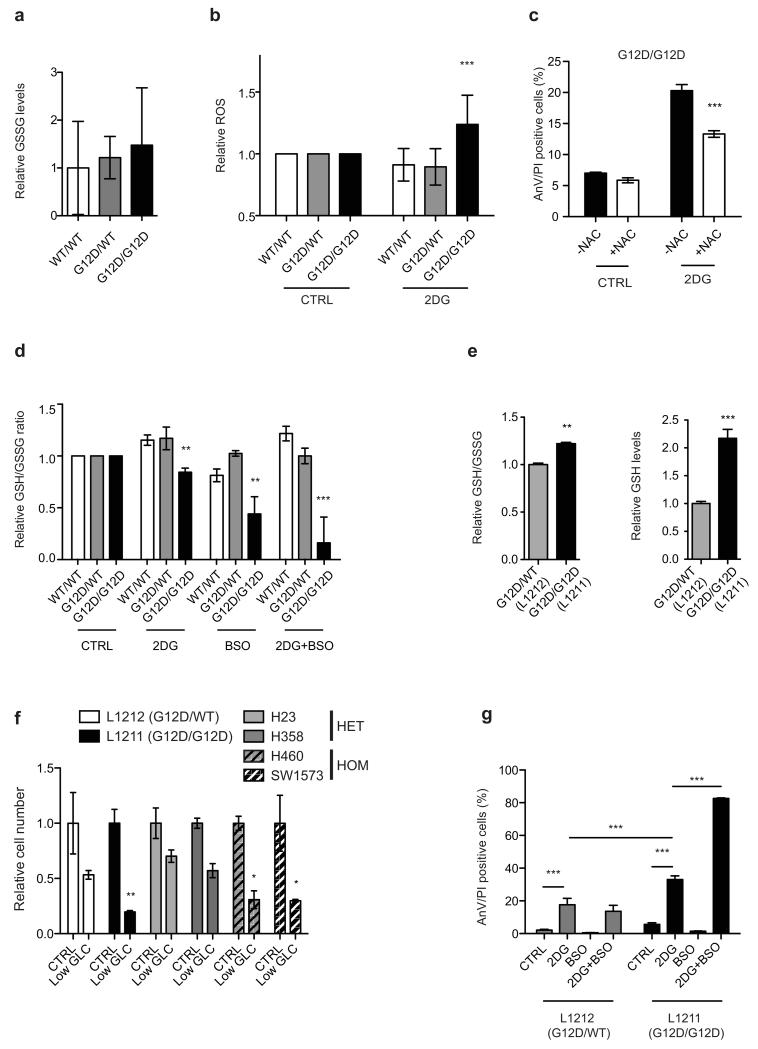
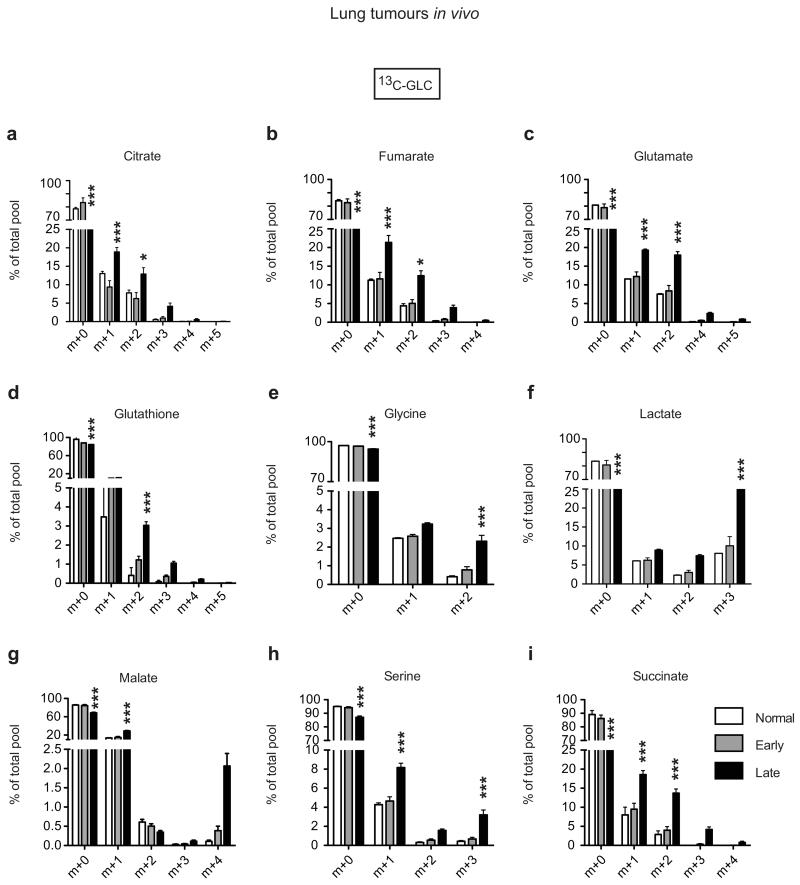
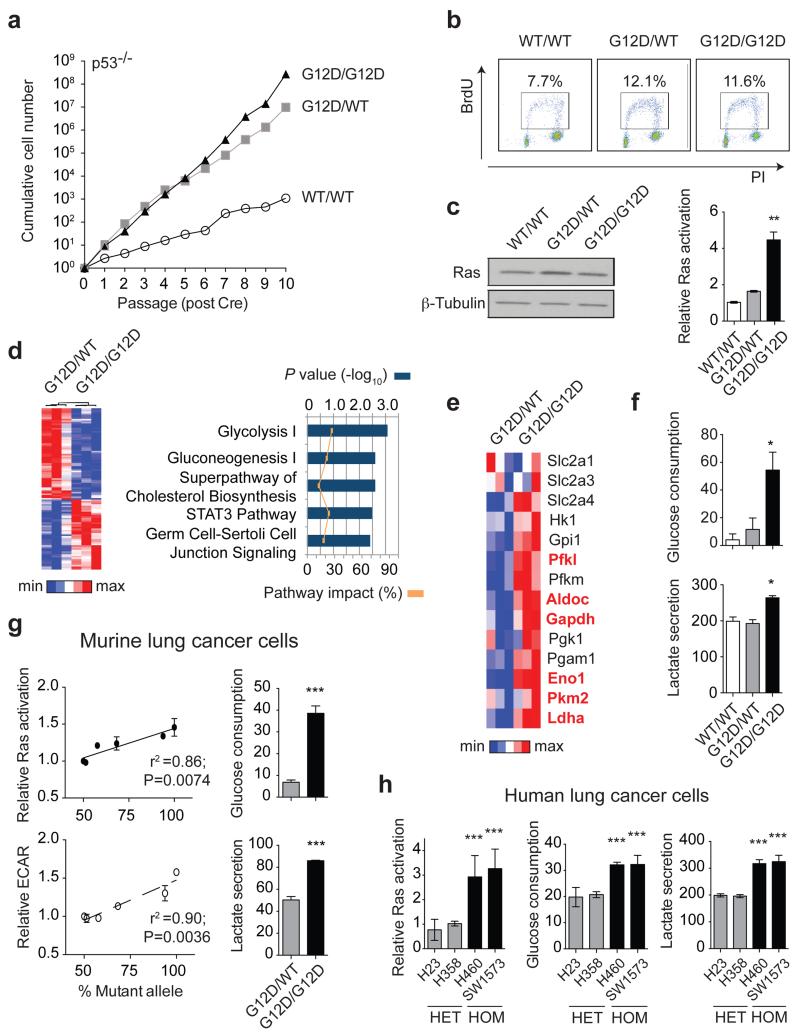
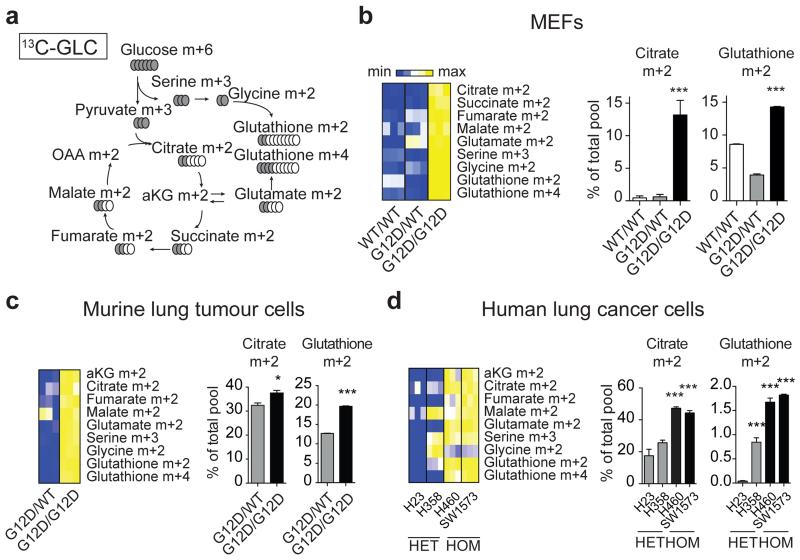
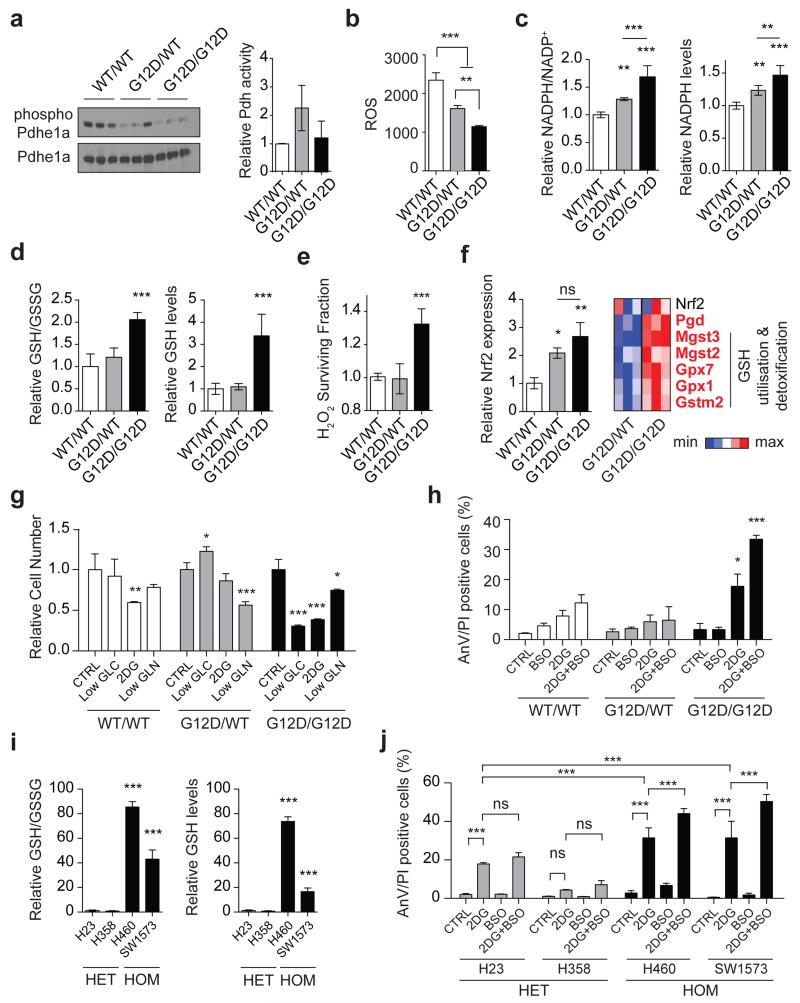
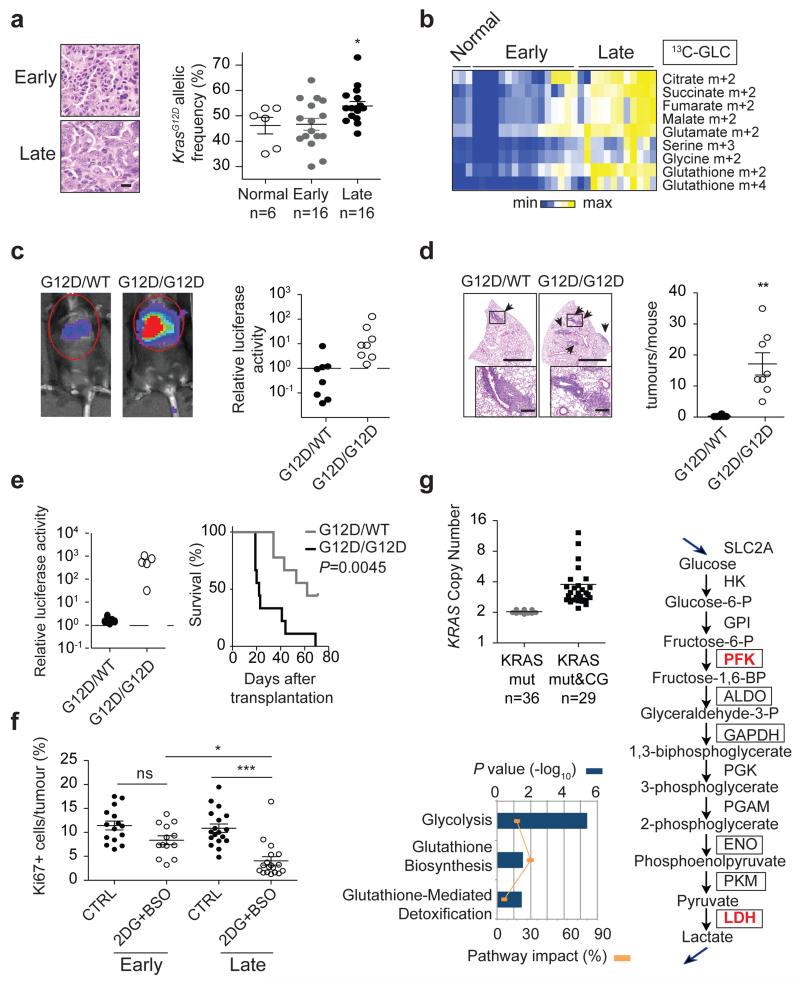
The RAS/MAPK (mitogen-activated protein kinase) signalling pathway is frequently deregulated in non-small-cell lung cancer, often through KRAS activating mutations. A single endogenous mutant Kras allele is sufficient to promote lung tumour formation in mice but malignant progression requires additional genetic alterations. We recently showed that advanced lung tumours from Kras(G12D/+);p53-null mice frequently exhibit Kras(G12D) allelic enrichment (Kras(G12D)/Kras(wild-type) > 1) (ref. 7), implying that mutant Kras copy gains are positively selected during progression. Here we show, through a comprehensive analysis of mutant Kras homozygous and heterozygous mouse embryonic fibroblasts and lung cancer cells, that these genotypes are phenotypically distinct. In particular, Kras(G12D/G12D) cells exhibit a glycolytic switch coupled to increased channelling of glucose-derived metabolites into the tricarboxylic acid cycle and glutathione biosynthesis, resulting in enhanced glutathione-mediated detoxification. This metabolic rewiring is recapitulated in mutant KRAS homozygous non-small-cell lung cancer cells and in vivo, in spontaneous advanced murine lung tumours (which display a high frequency of Kras(G12D) copy gain), but not in the corresponding early tumours (Kras(G12D) heterozygous). Finally, we demonstrate that mutant Kras copy gain creates unique metabolic dependences that can be exploited to selectively target these aggressive mutant Kras tumours. Our data demonstrate that mutant Kras lung tumours are not a single disease but rather a heterogeneous group comprising two classes of tumours with distinct metabolic profiles, prognosis and therapeutic susceptibility, which can be discriminated on the basis of their relative mutant allelic content. We also provide the first, to our knowledge, in vivo evidence of metabolic rewiring during lung cancer malignant progression.


Figures

<b>Extended Data Fig. 1</b>.
Extended Data Fig. 1.. Enhanced glycolysis in homozygous KrasG12D cells
a, Representative data (n=3) of PCR analysis of the Kras and p53 loci in KrasWT/WT (WT/WT), KrasG12D/WT (G12D/WT) and KrasG12D/G12D (G12D/G12D); p53Fx/Fx MEFs after Cre-mediated recombination; and of unrecombined KrasLSL-G12D/WT;p53loxP/loxP control (Cre-) (*: background band). b, IPA analysis of canonical pathways significantly altered in KrasG12D/G12D relative to KrasG12D/WT MEF transcriptomes (n=3/genotype). c, Representative qPCR data (n=3) of glycolytic gene expression in MEFs. Fold change relative to WT/WT shown as triplicate mean ±s.d. (one-way ANOVA). d, Extracellular acidification rate (ECAR) in MEFs following exposure to glucose, oligomycin and 2DG. Representative data from three independent MEFs/genotype show mean value between triplicates ±s.d. (two-way ANOVA). e, Kras locus analysis of two lung cancer cell lines (L1212 and L1211) generated from spontaneous tumours from KrasG12D/WT;p53-deficient mice. PCR (top) and pyrosequencing (lower panel) analysis shown (L1212: Kras heterozygous - G12D/WT; L1211: G12D homozygous - G12D/G12D). Recombined heterozygous MEFs shown as PCR control (CTRL). f, Representative qPCR data (n=3) of glycolytic gene expression in L1211 and L1212 lung tumour cells. Fold change relative to heterozygous cells shown (mean of triplicates ±s.d., ***P=<0.001, *P<0.05, t-test). g, Left: basal glucose consumption in murine lung tumour cells determined by FACS analysis of 6-NBDG uptake (%). *P=0.02, t-test. Right: extracellular lactate concentration (ng/dl/cell) in murine lung tumour cells. Data are triplicate mean ±s.d. *P=0.0139, t-test.
<b>Extended Data Fig. 2</b>.
Extended Data Fig. 2.. KrasG12D/WT and KrasG12D/G12D MEFs have similar biomass and mitochondrial functionality
a, Total protein content in indicated MEFs relative to WT/WT. b, Total RNA per cell for each of the indicated genotypes. c, d, WT/WT, G12D/WT and G12D/G12D MEFs were profiled by CASY counter (Roche) and cell volume (c) and diameter (d) measured. a-d, Mean value of three independent MEF triplicates/genotype ±s.d. shown. e, Oxygen consumption rate (OCR) of MEFs in response to oligomycin, CCCP and rotenone (two-way ANOVA). f, NAO staining was used to determine mitochondrial mass in KrasWT/WT (WT/WT), KrasG12D/WT (G12D/WT) and KrasG12D/G12D (G12D/G12D) MEFs. Geometric mean of NAO fluorescence in cells was determined by FACS. Representative overlay (left panel) and geometric mean (right panel) displayed. g, Mitochondrial architecture was examined after Mitotracker green staining in WT/WT, G12D/WT and G12D/G12D MEFs (scale= 10μm). h, TMRM staining was used to determine mitochondrial membrane potential in MEFs of indicated genotypes. Geometric mean of TMRM fluorescence in cells was determined by FACS. Representative overlay (left panel) and geometric mean (right panel) displayed. e-h, Representative data of 3 independent MEFs/genotype show mean of triplicates ±s.d., ***P<0.001, one-way ANOVA.
<b>Extended Data Fig. 3</b>.
Extended Data Fig. 3.. Glucose metabolism reprogramming in KrasG12D/G12D MEFs
a-j, Measurement of 13C-glucose-derived metabolites, calculated as a percentage (%) of the total metabolite pool following LC-MS analysis of WT/WT, G12D/WT and G12D/G12D MEFs after 4 hrs culture with 13C-glucose supplemented media. Representative data (of 2 independent MEFs/genotype) showing mean of triplicates ±s.d., ***P<0.001, **P<0.01, *P<0.05 (two-way ANOVA). Undetected isotopologues not shown.
<b>Extended Data Fig. 4</b>.
Extended Data Fig. 4.. Glucose metabolism reprogramming in lung tumour cells with mutant Kras copy gain
Measurement of 13C-glucose-derived metabolites, calculated as a percentage (%) of the total metabolite pool following LC-MS analysis of murine (L1211 and L1212, a-h) and human (H23, H358, H460, SW1573, i-p) mutant Kras heterozygous and homozygous lung tumour cells. Cells were cultured for 4 hrs with 13C-glucose supplemented media prior to analysis. Data show mean of triplicates ±s.d., ***P<0.001, **P<0.01, *P<0.05 (two-way ANOVA, relative to Krasmut heterozygous cells; i-p, homozygous samples significantly different from both heterozygous cell lines indicated). Undetected isotopologues not shown.
<b>Extended Data Fig. 5</b>.
Extended Data Fig. 5.. KrasG12D/WT and KrasG12D/G12D MEFs have distinct glutamine metabolism profiles
Glutamine metabolism analysis in WT/WT, G12D/WT and G12D/G12D MEFs. a, Representation of carbon flux (grey circles) from uniformly labelled 13C-labelled glutamine (13C-GLN). b, Heatmap illustrates abundance of selected labelled metabolites across triplicates of representative MEFs (two independent MEFs/genotype analysed) based on metabolomics analysis. c-i, Measurement of 13C-glutamine-derived metabolites, calculated as a percentage of the total metabolite pool following LC-MS analysis of WT/WT, G12D/WT and G12D/G12D MEFs after 4 hrs culture with 13C-glutamine supplemented media. Representative data (2 independent MEFs/genotype) show mean of triplicates ±s.d., (two-way ANOVA). j, Oxygen consumption rate (OCR) of WT/WT, G12D/WT and G12D/G12D MEFs upon glutamine (4 mM) addition. Representative data of 3 independent MEFs/genotype showing mean of triplicates ±s.d. k, Relative diversion (%) of glutamine to TCA (aKG m+5) or GSH (GSH m+5) in MEFs of indicated genotypes based on metabolomics data. Representative MEF data (n=2 MEFs/genotype) shows triplicate mean ±s.d. (one-way ANOVA). ***P<0.001, **P<0.01, *P<0.05.
<b>Extended Data Fig. 6</b>.
Extended Data Fig. 6.. KrasG12D homozygous cells depend on glucose metabolism reprogramming for ROS management
a, GSSG levels in G12D/WT and G12D/G12D MEFs relative to WT/WT. Mean data (n=3 MEFs/genotype) ±s.d. shown. b, ROS levels in MEFs following 48 hrs of 2DG treatment. Data were normalised to vehicle treatment (CTRL). c, Percentage of AnnexinV/PI (AnV/PI) double positive G12D/G12D MEFs following 48 hrs of 2DG treatment in the presence (+) or absence (−) of NAC. d, Ratio of reduced to oxidised glutathione (GSH/GSSG) determined for WT/WT, G12D/WT and G12D/G12D MEFs after incubation with 2DG, BSO or both (2DG+BSO) for 48 hrs, normalised to vehicle (CTRL). b-d, Representative data from 3 independent MEFs/genotype presented. Mean data for triplicates ±s.d. shown (two-way ANOVA). e, Representative data of GSH/GSSG ratio and GSH levels in murine G12D/G12D tumour cells relative to G12D/WT (t-test). f, Differential sensitivity of lung tumour cells to nutrient depletion. Lung tumour cells were cultured in normal media (CTRL) and low glucose (Low GLC) conditions for 72 hrs and viable cells counted and normalised to CTRL (two-way ANOVA). g, Percentage of AnnexinV/PI double positive murine tumour cells following 48 hrs treatment with BSO, 2DG, or both (2DG+BSO). e-g, Representative data (n=3 independent experiments) depicts triplicate mean ±s.d. (***P<0.001, two-way ANOVA). ***P<0.001, **P<0.01, *P<0.05.
<b>Extended Data Fig. 7</b>.
Extended Data Fig. 7.. Increased mutant Kras allelic content leads to glucose metabolism reprogramming in lung tumours in vivo
a-i, Control (no Cre) and tumour bearing KrasG12D/+;p53Fx/Fx mice were infused with 13C-glucose 12 (early group) or 16 weeks (late group) after adenoviral-Cre treatment and individual lung tumours (Early, n=16 and Late, n=12) or control lung (Normal, n=3) collected for LC-MS analysis (3 technical replicates/sample). Selected 13C-glucose-derived metabolites shown, calculated as a percentage of the total metabolite pool. Mean abundance per cohort ±s.e.m. shown. ***P<0.001, *P<0.05 (two-way ANOVA).
Figure 1
Figure 1. Mutant Kras copy gain upregulates glycolysis in MEFs and lung tumour cells
a, Proliferative rate of KrasWT/WT (WT/WT), KrasG12D/WT (G12D/WT) and KrasG12D/G12D (G12D/G12D);p53Fx/Fx MEFs. b, FACS analysis denoting BrdU+ MEFs. c, MEF Ras levels (immunoblotting) and activation (Raf-GST pull-down, normalised to WT/WT). d, Heatmap illustrating differential gene expression between G12D/WT and G12D/G12D MEFs (n=3/genotype, microarray); top canonical pathways altered shown (IPA). e, Glycolytic gene expression (MEF microarray-based heatmap). Genes significantly upregulated in G12D/G12D cells highlighted (Bold red, t-test). f, MEF glucose consumption and lactate secretion. g, Left: KrasG12D/KrasTotal allelic frequency (pyrosequencing) versus Ras activation or glycolysis (ECAR) in KrasG12D/WT;p53-deficient murine lung tumour cells (n=6) (Pearson’s correlation). Right: Glucose consumption and lactate secretion in G12D/WT and G12D/G12D cell line pair (t-test). h, Ras activation (normalised to H358), glucose consumption and lactate secretion in KRASmut heterozygous (HET: H23, H358) or homozygous (HOM: H460, SW1573) NSCLC cell lines. c,f,h, one-way ANOVA. a-c, Representative data of three independent MEFs/genotype; d-f, n=3/genotype. g,h, (histograms) Representative data (n=3 independent experiments). All graphs depict triplicate mean ±s.d (error bars). ***P<0.001, **P<0.01, *P<0.05.
Figure 2
Figure 2. Mutant Kras copy gain drives glycolysis and directs glucose metabolism towards TCA cycle and glutathione synthesis
Glucose metabolism flux analysis. a, Carbon flux (grey) from uniformly labelled 13C-glucose (13C-GLC) illustrated. Glucose metabolism profiles of indicated MEFs (b), murine (c) and human lung cancer cells (d) following LC-MS analysis. b-d, Representative data depict abundance of selected labelled metabolites. Triplicates (heatmaps) and triplicate mean ±s.d (graphs) shown. MEFs and human cell lines: one-way ANOVA; murine cell lines: t-test. ***P<0.001, *P<0.05.
Figure 3
Figure 3. Mutant Kras copy-number dictates redox state, metabolic dependencies and therapeutic susceptibilities
a, Total and phosphorylated Pdhe1a levels and Pdh activity in MEFs. b, Cellular ROS (CellRox); c, NADPH/NADP+ ratio and NADPH levels; d, GSH/GSSG ratio and GSH levels in MEFs. e, MEF survival upon 24 hrs H2O2 treatment. f, Nrf2 and Nrf2-target gene expression in MEFs (left: qPCR; right: microarray). Nrf2-targets significantly upregulated in homozygous MEFs highlighted (bold red, t-test). g, MEF viability after 72 hrs culture in low glucose (Low GLC), 2DG or low glutamine (Low GLN), relative to normal media (CTRL). h, Percentage of AnnexinV+/PI+ (AnV/PI positive, FACS) MEFs upon 48 hrs BSO, 2DG, or combined (2DG+BSO) treatment. i, GSH/GSSG ratio and GSH levels in KRASmut NSCLC cells. j, NSCLC cells treated as in (h). Triplicate mean ±s.d. shown for three independent MEFs/genotype (a,c,d,f) or for representative data (3 independent runs) (b,e,g,h,i,j). Data normalised to WT/WT (a,c-f) or HET mean (i). One-way (a-f,i) or two-way ANOVA (g,h,j). ***P<0.001, **P<0.01, *P<0.05, ns= not significant.
Figure 4
Figure 4. Mutant Kras copy gain results in increased malignancy and metabolic rewiring in vivo
a, Representative H&E sections (scale bar: 20 μm) and KrasG12D allelic frequency (pyrosequencing) in independent KrasG12D/+;p53Fx/Fx early and late lung tumours (n=4 mice/cohort) and normal lung (“Early”, “Late”, “Normal”; respectively). b, Relative abundance of selected 13C-glucose-derived metabolites (LC-MS) in samples from (a) (n=3 Normal, n=16 Early, n=12 Late). c, Representative imaging and luciferase activity/mouse 3 weeks after MEF transplantation (n=8/genotype). d, Representative H&E and quantification of lung tumours in MEF recipients (t-test). Arrows: lung tumours, scale bars: 2 mm (large), 250 μm (small). e, Left: luciferase imaging of lung cancer cell recipients (L1212, L1211), 3 weeks after transplantation (n=5/genotype, left). Right: recipient survival (Kaplan-Meier, n=9/genotype). f, Ki67+ quantification of Early and Late tumours treated for 48 hrs with 2DG+BSO or vehicle (CTRL) (n=3 mice/cohort). g, KRASmut TCGA lung adenocarcinoma analysis following tumour segregation into “KRASmut” (mutation) and “KRASmut&CG” (mutation+copy gain) cohorts. KRAS copy number/tumour shown (upper left). Differential expression of glycolysis and glutathione pathway genes illustrated (RNAseq, IPA; bottom left). Glycolytic genes significantly upregulated in KRASmut&CG tumours (bold red, RNAseq) or G12D/G12D MEFs (boxes, microarray) relative to heterozygous illustrated (right). Mean ±s.e.m (a,f,) or ±s.d. (d) shown. a,e, One-way Anova. ***P<0.001, **P<0.01, *P<0.05, ns= not significant.

Comment in

Similar articles

Cited by

References

    1. Cancer Genome Atlas Research, N Comprehensive molecular profiling of lung adenocarcinoma. Nature. 2014;511:543–550. - PMC - PubMed
    1. Ding L, et al. Somatic mutations affect key pathways in lung adenocarcinoma. Nature. 2008;455:1069–1075. - PMC - PubMed
    1. Vicent S, et al. ERK1/2 is activated in non-small-cell lung cancer and associated with advanced tumours. Br J Cancer. 2004;90:1047–1052. - PMC - PubMed
    1. Guerra C, et al. Tumor induction by an endogenous K-ras oncogene is highly dependent on cellular context. Cancer Cell. 2003;4:111–120. - PubMed
    1. Jackson EL, et al. The differential effects of mutant p53 alleles on advanced murine lung cancer. Cancer research. 2005;65:10280–10288. - PubMed

Publication types

MeSH terms

Associated data