. 2016 Feb 24;11(2):e0148762.
doi: 10.1371/journal.pone.0148762. eCollection 2016.

Structures of Two Melanoma-Associated Antigens Suggest Allosteric Regulation of Effector Binding

Affiliations

Structures of Two Melanoma-Associated Antigens Suggest Allosteric Regulation of Effector Binding

Joseph A Newman et al. PLoS One. .

Abstract

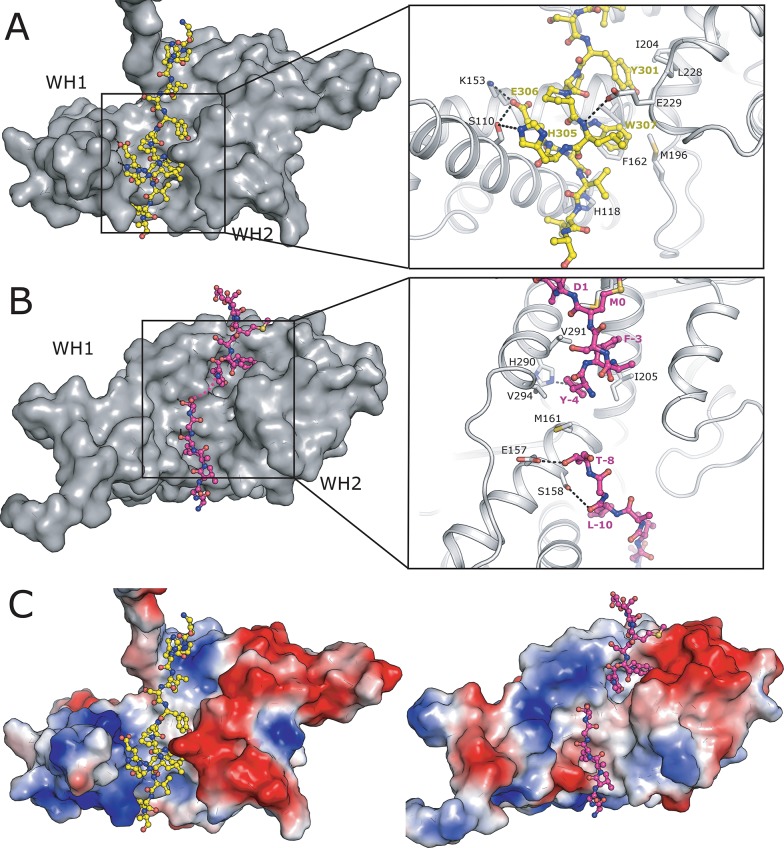
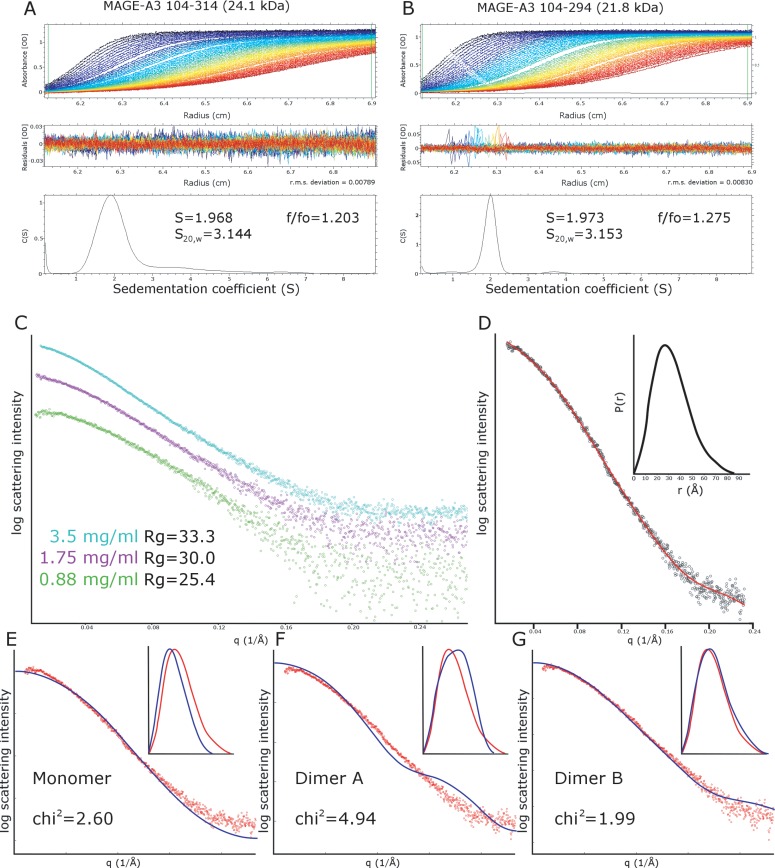
The MAGE (melanoma associated antigen) protein family are tumour-associated proteins normally present only in reproductive tissues such as germ cells of the testis. The human genome encodes over 60 MAGE genes of which one class (containing MAGE-A3 and MAGE-A4) are exclusively expressed in tumours, making them an attractive target for the development of targeted and immunotherapeutic cancer treatments. Some MAGE proteins are thought to play an active role in driving cancer, modulating the activity of E3 ubiquitin ligases on targets related to apoptosis. Here we determined the crystal structures of MAGE-A3 and MAGE-A4. Both proteins crystallized with a terminal peptide bound in a deep cleft between two tandem-arranged winged helix domains. MAGE-A3 (but not MAGE-A4), is predominantly dimeric in solution. Comparison of MAGE-A3 and MAGE-A3 with a structure of an effector-bound MAGE-G1 suggests that a major conformational rearrangement is required for binding, and that this conformational plasticity may be targeted by allosteric binders.


Conflict of interest statement

Competing Interests: The authors declare no competing interests. For full disclosure: This work was partly funded by the SGC, a registered charity (number 1097737) that receives funds from commercial entities (AbbVie, Bayer Pharma AG, Boehringer Ingelheim, GlaxoSmithKline, Janssen, Lilly Canada, Merck & Co., the Novartis Research Foundation, Pfizer and Takeda) as well as public funders (the Canada Foundation for Innovation, Genome Canada, the Ontario Ministry of Economic Development and Innovation, São Paulo Research Foundation-FAPESP, and the Wellcome Trust [092809/Z/10/Z]). All research results and reagents are placed in the public domain without patents. This does not alter the authors’ adherence to PLOS ONE policies on sharing data and materials.

Figures

Fig 1
Fig 1. Structure of the MHD domain of MAGE-A3 and MAGE-A4.
(A) Multiple sequence alignment of the MHD domains of MAGE-A3, MAGE-A4 and MAGE-G1, with the secondary structure elements of MAGE-A3 shown above for reference. (B) Overall structure of MAGE-A3 with secondary structure elements labelled. (C) Comparison of MAGE-A3 WH1 (green) and WH2 (orange). (D) Comparison of MAGE-A3 (orange) and MAGE-A4 (green). (E) Space filling representation of the arrangement of molecules in the MAGE-A4 crystals which form open ended interfaces via the N-terminal peptide sequence.
Fig 2
Fig 2. Interfaces of peptide sequences in the cleft between WH1 and WH2.
(A) Surface representation of MAGE-A3 with the C-terminal peptide sequence shown in the ball and stick representation. The box shows a close up view with polar contacts shown as dashed lines and key interface residues labelled. (B) Surface representation of MAGE-A4 with the N-terminal peptide bound in the cleft, viewed from the same angle as in 2A. (C) Surface representation of MAGE-A3 (left) and MAGE-A4 (right) coloured according to electrostatic potential ± 5 kT/e. Both structures are viewed from the same angle as in 2A and 2B.
Fig 3
Fig 3. Analysis of MAGE-A4 in solution.
(A) Gel filtration profiles of MAGE-A4 constructs with and without the N-terminal His tag, in the presence and absence of galactose. The elution volumes of size standards used for calibration are marked with black arrows. The inset shows a typical SDS PAGE gel of MAGE-A4 which shows two bands of approximately 25 and 45 kDa connected by a smear. (B) Analytical ultracentrifugation of cleaved MAGE-A4. The raw absorbance data plotted as a function of radius and time is shown in the top panel, the centre panel shows the distribution of residuals from the fit of the diffusion deconvoluted continuous distribution c(s) model, and the bottom panel shows the distribution of sedimentation coefficient values from the data fit.
Fig 4
Fig 4. Structures of the two possible dimers present in the MAGE-A3 crystals.
(A) Type A dimers linked by insertion of the C-terminal peptide into the cleft between WH1 and WH2. (B) Type B dimers linked by the extended β-hairpin, the insert shows a detailed view of the interface with interacting residues labelled and polar contacts shown as dashed lines.
Fig 5
Fig 5. Analysis of MAGE-A3 in solution.
(A-B) Analytical ultracentrifugation of MAGE-A3 constructs with (A) and without (B) the C-terminal peptide required to form type A dimers. The raw absorbance data plotted as a function of radius and time is shown in the top panel, the centre panel shows the distribution of residuals from the fit of the diffusion deconvoluted continuous distribution c(s) model, and the bottom panel shows the distribution of sedimentation coefficient values from the data fit. (C) Small angle X-ray scattering curves for MAGE-A3 (construct 104–314, containing the C-terminal peptide), collected at three different protein concentrations show significant concentration dependence in the Guinier region. (D) Distance distribution function P(r), calculated from the MAGE-A3 SAXS data, the main plot shows the fit of the P(r) function to the data with the distribution in the insert. (E-G) Comparisons of the experimental SAXS data and theoretical SAXS curves calculated from the MAGE-A3 monomer (E), dimer A (F) and dimer B (G). The main plot shows the fit in reciprocal space using the program CRYSOL[33], and the insert shows the fit in real space calculated with the program SCATTER (www.biosis.net).
Fig 6
Fig 6. Sequence alignment of the MAGE homology domain of representative human MAGE sequences.
Sequences were aligned using CLUSTALX and visualised with Jalview. Alignment numbering is according to MAGE-A4 residue number. Secondary structure is aligned to the MAGE-A4 structure, with α-helices as red cylinders, β-strands as green arrows and 310 helices as purple cylinders. Residue conservation is represented by the histogram, with a scale from 0 (no conservation) to 9, with complete identity denoted by an asterisk. Residues E232 and D236 in the dimer interface of MAGEA3 (marked with *) are found only in MAGEA3, MAGEA6 and MAGEA2; the corresponding residues in MAGEA3 are D233 and H237.
Fig 7
Fig 7. Comparisons between MAGE-G1 and MAGE-A3/A4.
(A) Comparison of the relative conformations of WH1 and WH2 in the MAGE-G1 structure (open form) and in the MAGE-A3/A4 structures (closed form, shown as semi-transparent cartoons), the original connectivity is shown on the left and the re-refined on the right hand side. (B) Superposition of the MAGE-A3 (orange), MAGE-A4 (green) and MAGE-G1 (pink) structures on the basis of the individual WH1 and WH2 domains.
Fig 8
Fig 8. Re-analysis of the MAGE-G1 NSE1 model.
(A) View of the original (red ribbon) and alternate (black ribbon) choices around the crystallographic symmetry axis (shown as green lines). A single NSE-1 is shown as grey spheres. (B) Electron density maps in the region connecting WH1 and WH2. The 2Fo-1Fc (blue) and Fo-Fc (green) electron density maps (calculated with all atoms between 161 and 171 omitted from the model) are shown contoured at 0.9 σ and 2.4 σ respectively with the domains coloured as for panel A. (C) Comparison of the interfaces between the original (semi-transparent cartoon) and alternative (opaque cartoon) MAGE-G1 models and NSE-1 (shown in the surface representation). The insert shows a detailed view of the additional interface in the alternate model with interacting residues labelled and shown in the stick format and polar contacts shown as dashed lines. (D) Possible MAGE-G1 NSE-1 hetero-tetramer found in the MAGE-G1 NSE-1 crystallographic asymmetric unit with the two MAGE-G1 monomers (shown in green and blue) topologically interlinked.
Fig 9
Fig 9. Examination of physically unlikely features in the MAGE-G1 NSE-1 complex structure 3NW0.
(A) Zinc ion coordination in the NSE-1 structure by three cysteine residues and a histidine which clearly needs to be rotated to make chemical sense. (B) Tryptophan sidechain which is truncated at Cβ in the 3NW0 model, with insufficient space for any of the possible rotamers (shown in a semi-transparent stick representation) to be accommodated without significant steric clashes. (C-D) Large gaps in the structure with distances incompatible with a single missing residue. Gaps are shown by dashed lines with distances and residue registers labelled accordingly.

References

    1. van der Bruggen P, Traversari C, Chomez P, Lurquin C, De Plaen E, Van den Eynde B, et al. A gene encoding an antigen recognized by cytolytic T lymphocytes on a human melanoma. Science. 1991;254(5038):1643–7. . - PubMed
    1. Barker PA, Salehi A. The MAGE proteins: emerging roles in cell cycle progression, apoptosis, and neurogenetic disease. Journal of neuroscience research. 2002;67(6):705–12. . - PubMed
    1. Chomez P, De Backer O, Bertrand M, De Plaen E, Boon T, Lucas S. An overview of the MAGE gene family with the identification of all human members of the family. Cancer research. 2001;61(14):5544–51. . - PubMed
    1. De Smet C, Courtois SJ, Faraoni I, Lurquin C, Szikora JP, De Backer O, et al. Involvement of two Ets binding sites in the transcriptional activation of the MAGE1 gene. Immunogenetics. 1995;42(4):282–90. . - PubMed
    1. De Smet C, Lurquin C, Lethe B, Martelange V, Boon T. DNA methylation is the primary silencing mechanism for a set of germ line- and tumor-specific genes with a CpG-rich promoter. Molecular and cellular biology. 1999;19(11):7327–35. - PMC - PubMed

Publication types