. 2016 Feb 23;110(4):896-911.
doi: 10.1016/j.bpj.2015.12.033.

Dynamics of the Ligand Binding Domain Layer during AMPA Receptor Activation

Affiliations

Dynamics of the Ligand Binding Domain Layer during AMPA Receptor Activation

Jelena Baranovic et al. Biophys J. .

Abstract

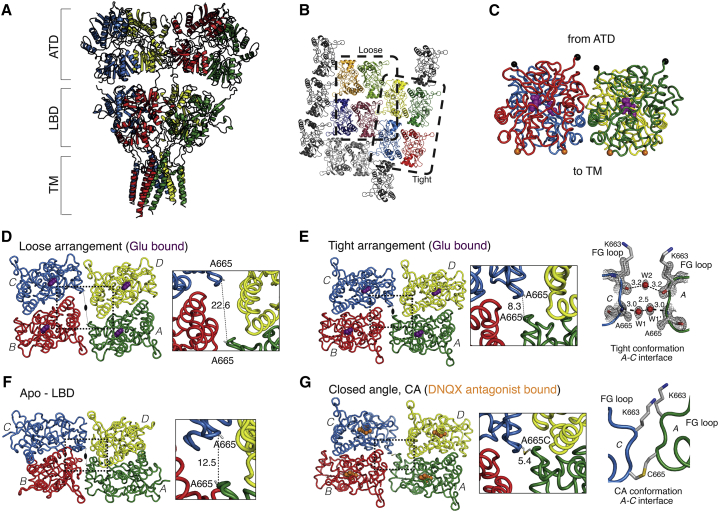
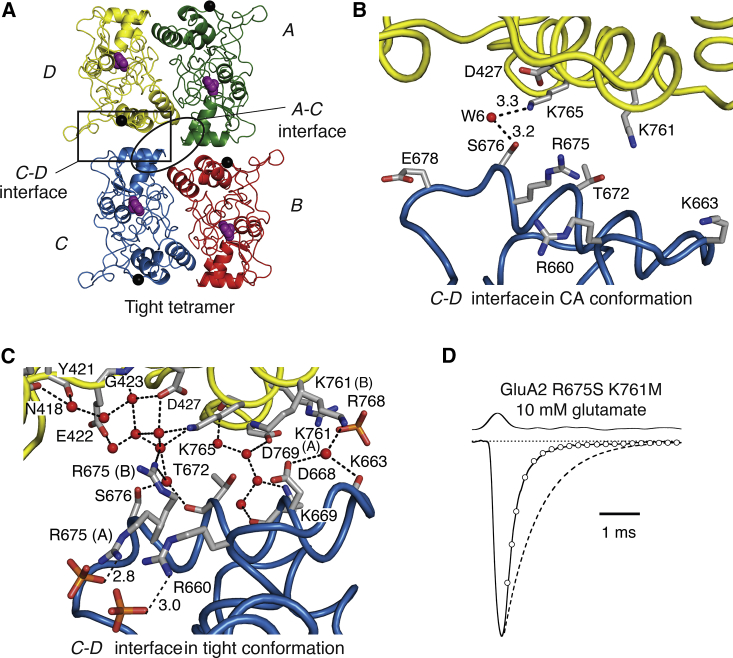
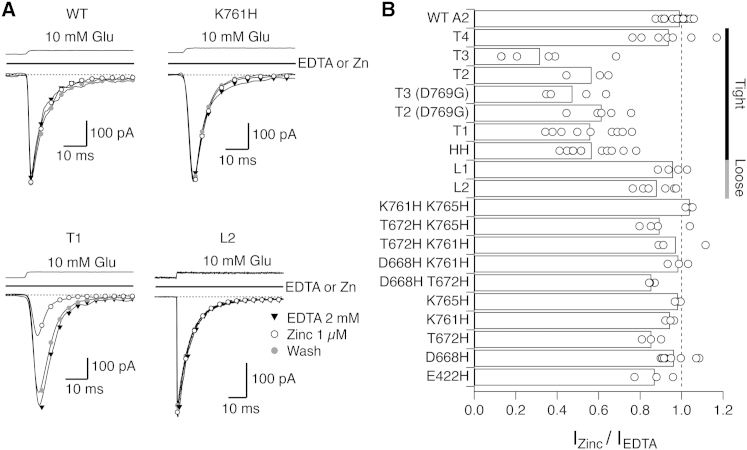
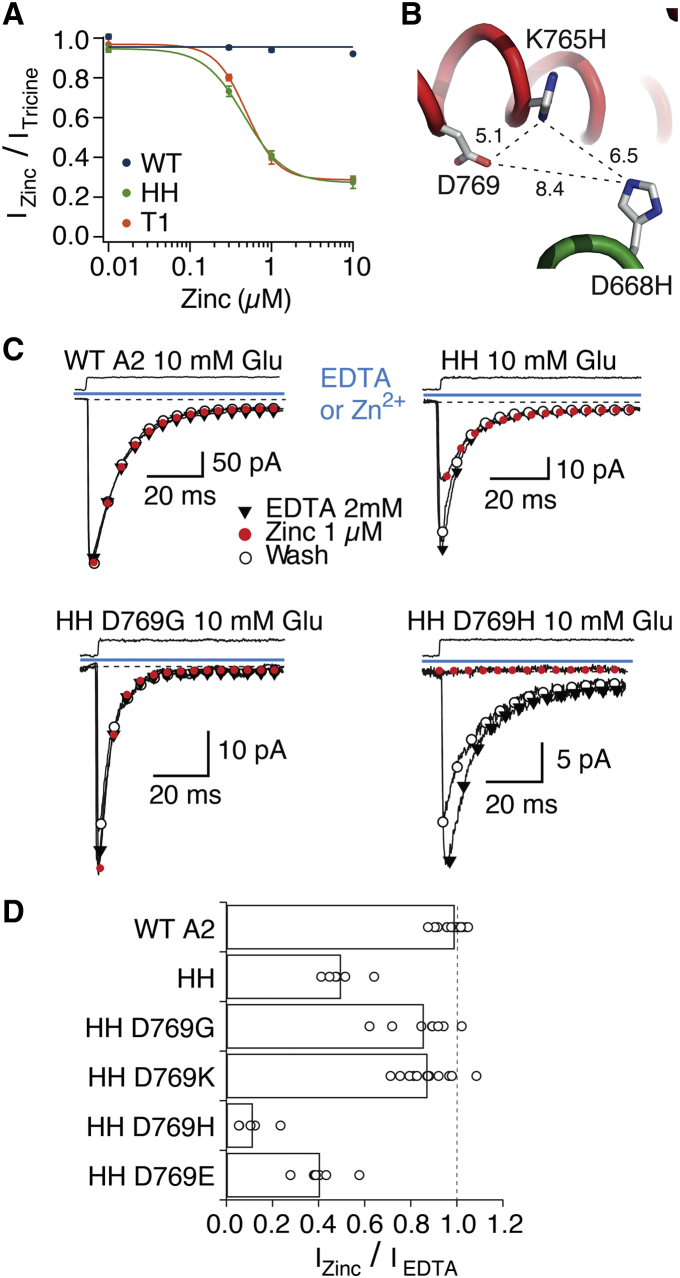
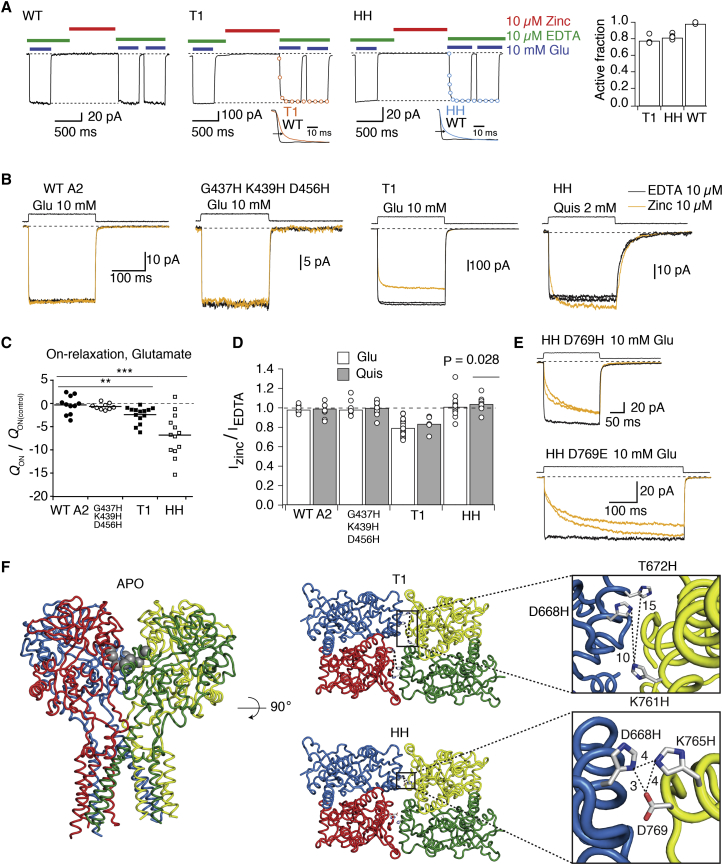
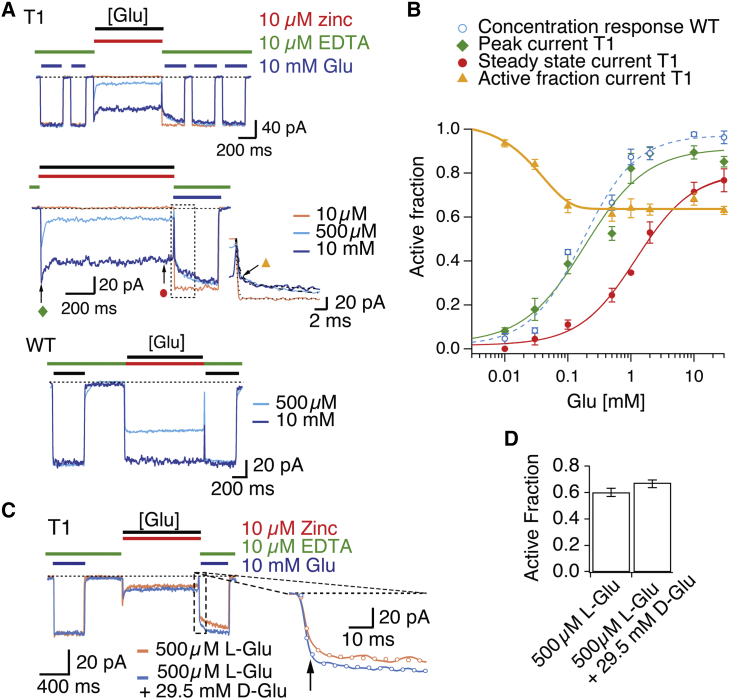
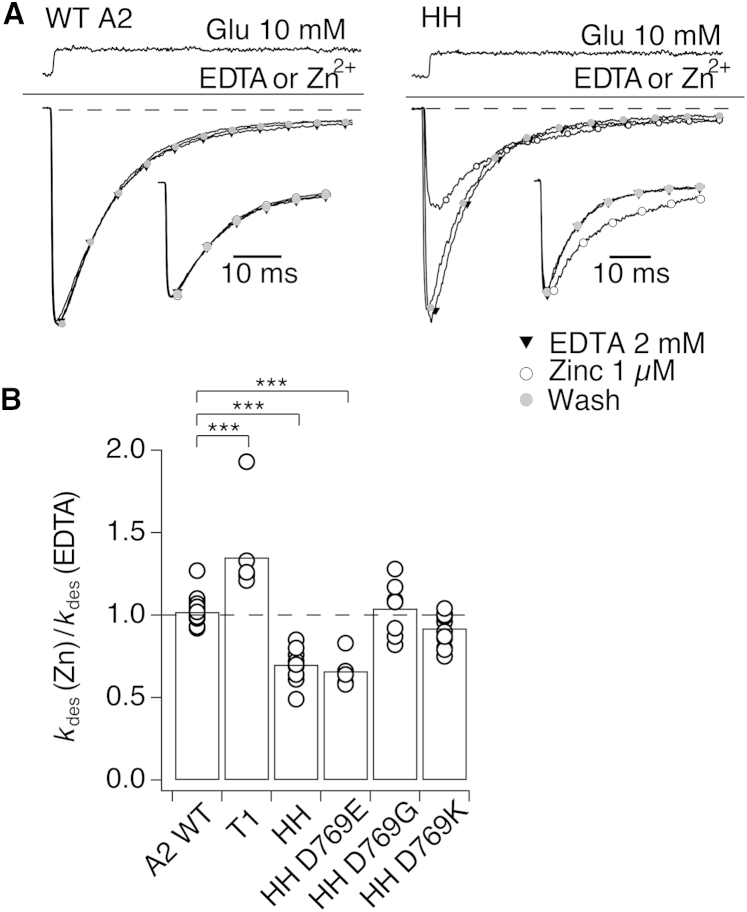
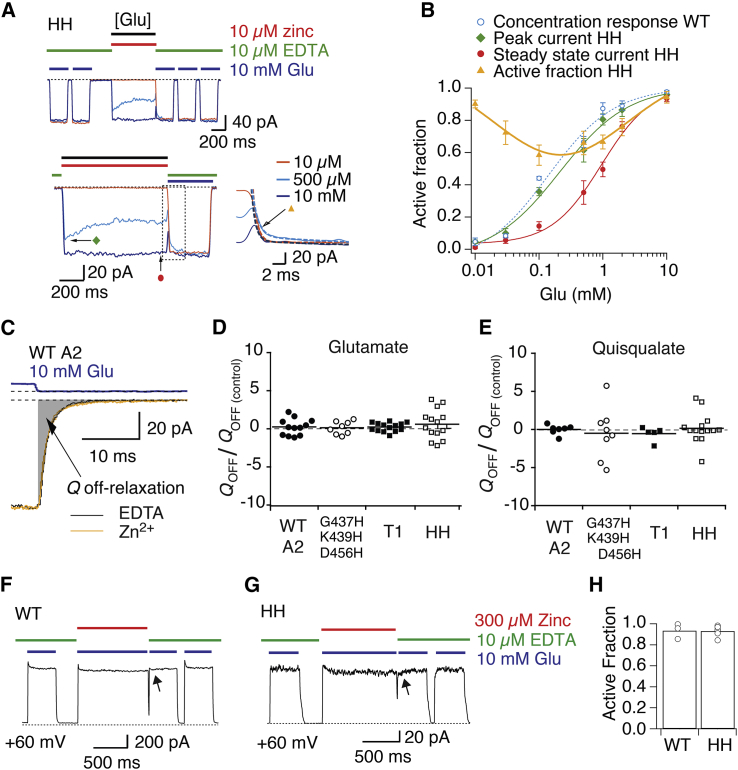
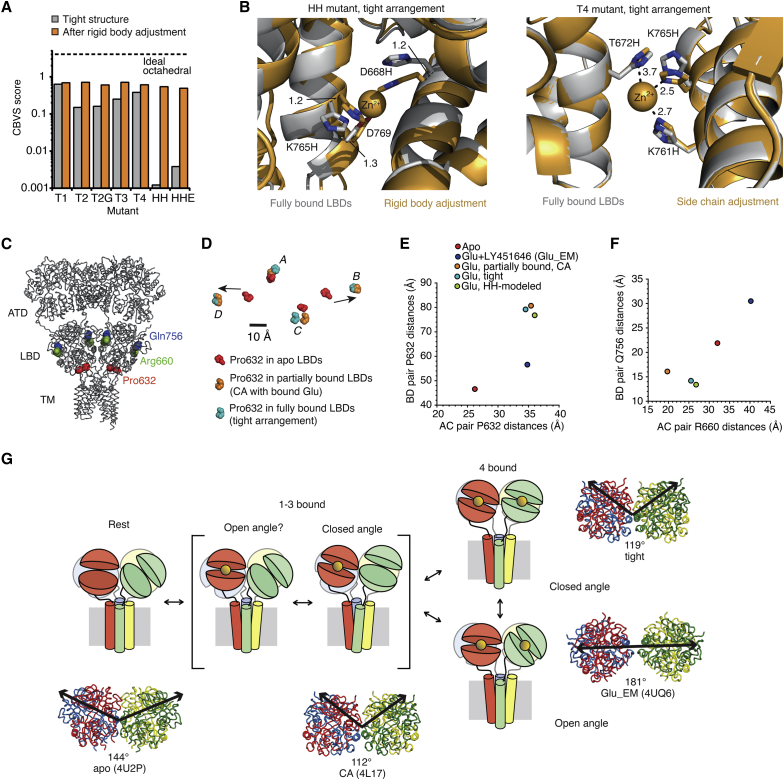
Ionotropic glutamate receptors are postsynaptic tetrameric ligand-gated channels whose activity mediates fast excitatory transmission. Glutamate binding to clamshell-shaped ligand binding domains (LBDs) triggers opening of the integral ion channel, but how the four LBDs orchestrate receptor activation is unknown. Here, we present a high-resolution x-ray crystal structure displaying two tetrameric LBD arrangements fully bound to glutamate. Using a series of engineered metal ion trapping mutants, we showed that the more compact of the two assemblies corresponds to an arrangement populated during activation of full-length receptors. State-dependent cross-linking of the mutants identified zinc bridges between the canonical active LBD dimers that formed when the tetramer was either fully or partially bound by glutamate. These bridges also stabilized the resting state, consistent with the recently published full-length apo structure. Our results provide insight into the activation mechanism of glutamate receptors and the complex conformational space that the LBD layer can sample.


Figures

Figure 1
Figure 1
Crystal structures of tetrameric GluA2 LBDs in complex with agonists or antagonists. (A) GluA2 receptor structure with unliganded (apo) LBDs (PDB: 4U2P). Squared brackets indicate domain layers: ATD, amino terminal domains; LBD, ligand binding domains; TM, transmembrane region. Subunit coloring is as follows: A, green; B, red; C, blue; D, yellow. (B) The crystal packing with two molecules in the asymmetric unit (chains A and B) produces two different tetramers containing identical LBD active dimers. One layer of LBD molecules is shown with the tight and the loose tetramer being boxed with the same coloring. The tight and loose tetramers are built by four molecules of chain B and A, respectively. Subunits are colored according to the full-length receptor (those in the loose tetramer are shown in darker colors). (C) The crystal packing of both tetramers leads to a physiologically plausible tetramer arrangement (shown here for the tight tetramer) with all four ATD linkers (black spheres, Lys393) facing to one side and the four TM linkers (Pro632, orange spheres) facing to the other side. (DG) Top views of LBD layer. (D) LBD tetramer fully bound by glutamate in the loose arrangement. (E) LBD tetramer fully bound by glutamate in the tight arrangement. The A-C interface is shown, with 2Fo-Fc density contoured at 1 sigma in gray mesh. (F) LBDs from the apo full-length structure (PDB: 4U2P). (G) LBDs in the CA arrangement in complex with DNQX (PDB: 4L17). Right panel shows the interface between A and C subunits from the side. The overall interdimer twofold axes are shown as black ovals; individual subunits are color-coded as indicated in (A); antagonist (DNQX) is shown as orange and agonist (glutamate) as purple spheres. For each structure, the distance (in Ångstroms) between the Cα atoms of A665 in molecules A and C is shown in the inset, magnification of the dotted boxes. To see this figure in color, go online.
Figure 2
Figure 2
The tight arrangement and the intersubunit interfaces. (A) Ribbon representation of the tight tetramer with all four subunits bound to glutamate (purple spheres). Interfaces are indicated with an outlined box and named according to the subunits involved (A-C and C-D interface, respectively). (B) Zoom into the interface between subunits C and D in the CA arrangement (PDB: 4L17). Water molecules are depicted as red spheres. Dashed lines represent hydrogen bonds. All distances are in Ångstroms. (C) The same lateral interface in the tight arrangement. Alternative conformations for side chains are indicated in parentheses (A) and (B). One alternate conformation of R675 is stabilized by a phosphate ion (orange sticks) from the crystallization buffer. (D) Patch clamp recording of the rapid deactivation of the GluA2 R675S K761M double mutant (deactivation time constant from the exponential fit (open circles) is 3300 s–1 for this trace). Dashed line shows WT deactivation. The upper trace shows the solution exchange for the nominal 1 ms glutamate pulse. To see this figure in color, go online.
Figure 3
Figure 3
Functional trapping of glutamate-bound tight and loose tetrameric arrangements. (A) Representative current traces of WT and mutant receptors designed to distinguish between the tight and loose tetrameric arrangements of LBDs observed in the crystal. Patches were exposed to zinc-free (EDTA) solution (triangles), then to 1 μM zinc (open circles) and then washed again with EDTA (gray circles). WT GluA2 was not sensitive to zinc. (B) Summary of peak current responses in zinc, relative to the EDTA control responses. From the four mutants predicted to trap by the tight arrangement (T1-4), three were robustly inhibited by zinc (T1, T2, and T3). Two mutants predicted to cross-link by the loose arrangement (L1-2) showed minimal modification in the tested conditions. The control double mutant HH was unexpectedly inhibited, whereas T4 mutant was not modified despite being predicted by the tight arrangement.
Figure 4
Figure 4
Zinc coordination by the HH mutant. (A) Half-maximal inhibition of currents activated by 10 mM glutamate (in the absence of CTZ) by zinc was similar for both mutants HH and T1, with IC50 of 370 ± 20 and 380 ± 10 nM, respectively (n = 3 patches for both). (B) Cartoon diagram shows a plausible arrangement of side chains in the HH mutant, modeled into the tight LBD arrangement. Distances are in Ångstroms. Native residue D769 was chosen as the most likely third coordinating partner of zinc in the bridge and tested through a series of mutants. (C) Representative traces of jumps into 10 mM glutamate in the presence of 1 μM zinc (red circles) or its absence (black triangles) for mutants HH, HH D769G, and HH D769H. The inhibition was reversible, as shown by the wash in 2 mM EDTA (open circles). (D) Summary of inhibition of D769 mutants by 1 μM zinc. To see this figure in color, go online.
Figure 5
Figure 5
Apo state trapping. (A) WT receptors are unaffected by 1 s exposure to zinc (10 μM) in the absence of any ligand, but both, the T1 and HH mutants exhibit slower on-relaxation upon jump into (zinc-free) glutamate. For both mutants, the on-relaxation contained two components: τ1 = 5 ± 0.5 ms and τ2 = 91 ± 12 ms (n = 4 patches) for T1 and τ1 = 9 ± 4 ms and τ2 = 90 ± 12 ms (n = 4) for HH. The faster component reflects the solution exchange, and the slower component corresponds to relaxation from zinc trapping, i.e., lifetime of the bridges formed in zinc. The bar graph shows the residual active current after exposure in the apo state to 10 μM zinc. (B) Traces showing WT and mutant receptors jumped into 10 mM glutamate (Glu) or 2 mM quisqualate (Quis) in the absence (10 μM EDTA, black traces) or presence of zinc (10 μM, orange traces) with zinc or EDTA present throughout the recording. CTZ (100 μM) was also present throughout the recording to block desensitization. The effects of zinc are reversible as shown by alternating jumps between zinc-containing and zinc-free solutions. (C) Summary of the effects of zinc on the on-relaxation. For each patch, traces in EDTA and zinc were separately averaged and normalized to their peak. Their difference trace was then integrated to obtain the cumulative difference in charge (Q). We determined the average variability of QON within groups (QON(control)) to control for the inherent variability. QON was then normalized by QON(control). QON was measured 100 ms after the start of the agonist pulse. The trapping mutants, T1 and HH both showed slower on-relaxation in zinc, and thus a deficit of charge during the rise to the peak current, in both glutamate and quisqualate (not shown) ∗∗∗p < 0.001, p < 0.05. (D) Plot summarizing the effects of zinc on the steady-state current in glutamate (white bars) and quisqualate (gray bars) for T1, HH, and the controls (WT and CA-HHH). The steady-state current is the average current of the last 30 ms of the agonist pulse. (E) The HH D769H mutant showed a similar functional profile to the T1 mutant when equilibrated in 10 μM zinc and jumped into 10 mM glutamate in the presence of 100 μM CTZ. The effect was reversible as seen from alternating jumps into 10 μM zinc (orange traces) and zinc-free solution (10 μM EDTA, black traces). The effect of zinc on the HH D769E mutant was similar, and jumps were extended to 500 ms to allow the current to plateau. (F) The apo structure (PDB: 4U2P, with ATDs omitted) with the T1 and HH mutations modeled as gray spheres. Top views of the LBD assembly, with boxed sections expanded to show the side chains forming the sites in gray, stick representation. Distances (dotted lines) between the mutated residues are in Ångstroms. Unlike HH, the T1 site is not expected to be bridged by zinc without rearrangement. To see this figure in color, go online.
Figure 6
Figure 6
State-dependence of the T1 zinc bridge. (A) Patch-clamp experiment showing five test pulses (2 + 3) of 10 mM glutamate (blue bars) in the presence of 10 μM EDTA (green bars), flanking the application (1 s) of 10 μM zinc (red) with different concentrations of glutamate (indicated by the black bar): 10 μM (orange trace), 500 μM (light blue), 10 mM (dark blue). CTZ (100 μM) was present throughout the experiment. Middle panel (zoom of the top panel) shows relaxation observed at 500 μM and 10 mM glutamate (τ = 35 ± 2 ms and τ = 32 ± 9 ms, n = 6–9 patches, respectively). The active fraction is indicated in the inset with an orange triangle. The recovery of current in 10 mM glutamate and EDTA following trapping at different concentrations showed a common fast component (τ = 3 ± 0.4 ms, n = 6 patches) corresponding to the exchange of solution and a slow component (τ =106 ± 30 ms, n = 6 and τ = 147 ± 14 ms, n = 6 patches, following trapping in 500 μM and 10 mM glutamate, respectively). WT A2 shows no modification by zinc in 500 μM and 10 mM glutamate, bottom panel. (B) Glutamate concentration-response curves in 10 μM zinc for WT GluA2 (blue circles; EC50 = 170 ± 40 μM), T1 before trapping by zinc (green diamonds; EC50 = 348 ± 80 μM), and T1 following trapping (red circles; EC50 = 6.4 ± 2.9 mM). The difference between the apparent affinities for glutamate for WT and T1 in the absence of zinc was not significant (p = 0.2). The relationship between the active (untrapped) fraction and log-concentration of glutamate followed an exponential function (yellow triangles). (C) Correction for chelation of zinc by high glutamate. Blue trace shows response of mutant T1 to 500 μM L-glutamate in the presence of 10 μM zinc (red bar), flanked by 10 mM L-glutamate test pulses in EDTA (green bars). Orange trace shows the application of 29.5 mM D-glutamate in addition to 500 μM L-glutamate and 10 μM zinc. Following the application of zinc, a larger active fraction (as estimated from the larger instantaneous current activated by 10 mM glutamate) was observed in the presence of 29.5 mM D-glutamate than in its absence (inset arrow), presumably due to zinc chelation. (D) The chelation effect at 30 mM glutamate reduced trapping by 9 ± 2%. Thus, the trapped fraction was underestimated due to a lower free zinc concentration. The 30 mM glutamate value for the active fraction in Fig. 6B, was reduced accordingly by a factor of 1.09. To see this figure in color, go online.
Figure 7
Figure 7
The HH bridge alters desensitization. (A) Zinc slows the desensitization decay of the HH mutant (open circles), compared to the desensitization in EDTA (control, black triangles; wash, gray solid circles). Zinc accelerated the decay of the T1 mutant. Insets show the normalized currents. (B) The HH mutant and the HH D769E mutant both have markedly slower desensitization decays. The kinetics of control mutants was not different from WT GluA2.
Figure 8
Figure 8
State dependence of the HH zinc bridge. (A) The traces show an experiment similar to that described in Fig. 6A, but for the HH mutant. Lower panel (zoomed from the top panel) shows relaxation at 500 μM glutamate (light blue) and no trapping at 10 mM glutamate (dark blue). (B) Glutamate concentration-response curves in 10 μM zinc for WT GluA2 (blue open circles; EC50 = 170 ± 40 μM), HH before trapping by zinc (green diamonds; EC50 = 220 ± 50 μM), and HH following trapping (red circles; EC50 = 950 ± 50 μM). The difference between the apparent affinities for glutamate for WT and HH in the absence of zinc was not significant (p = 0.06). The active fraction after trapping shows a shallow bell-shaped distribution with maximum trapping at 215 μM glutamate (n = 6 patches) (yellow triangles). (C) The off-relaxations in Zn2+ and EDTA were quantitated by the difference in charge transfer, normalized to the variability within groups as described for QON in the legend to Fig. 5C. QOFF was determined over the interval up to 200 ms after the end of the agonist pulse. (D) Summary plots of the normalized difference between charge transfer in the glutamate decay between control and zinc. Neither T1 nor HH showed any change in the deactivation decay. (E) As for (D), but following a quisqualate jump. (F) Outward currents from WT GluA2 show little effect of 300 μM zinc. (G) Outward currents activated by 10 mM glutamate for the HH mutant were not modified following a jump into 300 μM zinc. There was no change in the active fraction (arrow). (H) Bar graph showing the active fraction after application of 300 μM zinc was not significantly different from that of WT 93 ± 2 and 93 ± 3% for HH and WT, respectively (p = 0.8, n = 4 patches for both). To see this figure in color, go online.
Figure 9
Figure 9
The active conformations and receptor activation. (A) CBVS scores for zinc coordination by mutants modeled into the tight tetramer (gray bars), and the same analysis for tetramers in which the active dimers were allowed to relax as rigid bodies (orange bars). (B) Left panel: alignment of the tight tetramer (gray) and the translated-dimer structure optimized for coordination of zinc (orange sphere) by the HH mutant by rigid body translation of the dimers (orange). Right panel: coordination of zinc by the T4 mutant before and after rigid body translation. Modeling reveals steric clashes between T672H and K765H. (C) Sites of Arg660 (marker for subunits A/C, green spheres), Gln756 (marker for subunits B/D, blue spheres) and Pro632 (LBD-TM3 marker, red spheres) in the full-length receptor (gray, PDB: 4U2P). (D) Lateral positions of Pro632, aligned in plain view, are shown for apo conformation (red), CA in which the subunits B and D are modeled bound by glutamate (orange), and the tight tetramer (cyan). Arrows indicate the direction of Pro632 displacement from apo LBDs toward LBDs partially (CA) and fully (tight) populated by glutamate. (E) Displacements of Pro632, measured diagonally between the subunits (A-C) and (B-D) in the full-length receptor for apo (red), the glutamate bound active state model from EM (Glu_EM, blue), the partly bound conformation (CA, orange), the tight tetramer conformation before (tight, cyan) and after (HH-modeled, green) rigid body movement to accommodate zinc in the HH mutant. (F) Diagonally opposed residues at the core of the LBD tetramer Arg660 and Gln756, with the same color code as in (D). (G) Cartoon of proposed LBD movements during receptor activation, with the amino terminal domain omitted for clarity. The open angle, fully bound form represents the glutamate bound active state model from EM (Glu_EM). The open angle, partly bound form has not been captured in crystal structures, but is included here for completeness (indicated with a question mark). Cartoons are accompanied by ribbon representations of the respective LBDs (PDB IDs in brackets). Subunits are color coded as in Fig. 1A. Black arrows indicate vectors defined for determination of the interdimer angle between dimer pairs A-D and B-C with the vertex at the center of mass of 665 Cα atoms in subunits A and C (15). To see this figure in color, go online.

References

    1. Sobolevsky A.I., Rosconi M.P., Gouaux E. X-ray structure, symmetry and mechanism of an AMPA-subtype glutamate receptor. Nature. 2009;462:745–756. - PMC - PubMed
    1. Karakas E., Furukawa H. Crystal structure of a heterotetrameric NMDA receptor ion channel. Science. 2014;344:992–997. - PMC - PubMed
    1. Lee C.-H., Lü W., Gouaux E. NMDA receptor structures reveal subunit arrangement and pore architecture. Nature. 2014;511:191–197. - PMC - PubMed
    1. Dürr K.L., Chen L., Gouaux E. Structure and dynamics of AMPA receptor GluA2 in resting, pre-open, and desensitized states. Cell. 2014;158:778–792. - PMC - PubMed
    1. Chen L., Dürr K.L., Gouaux E. X-ray structures of AMPA receptor-cone snail toxin complexes illuminate activation mechanism. Science. 2014;345:1021–1026. - PMC - PubMed

Publication types

LinkOut - more resources