. 2016 Feb 23;110(4):939-46.
doi: 10.1016/j.bpj.2015.12.035.

Single-Molecule Imaging in Living Drosophila Embryos with Reflected Light-Sheet Microscopy

Affiliations

Single-Molecule Imaging in Living Drosophila Embryos with Reflected Light-Sheet Microscopy

Ferdinand Greiss et al. Biophys J. .

Abstract

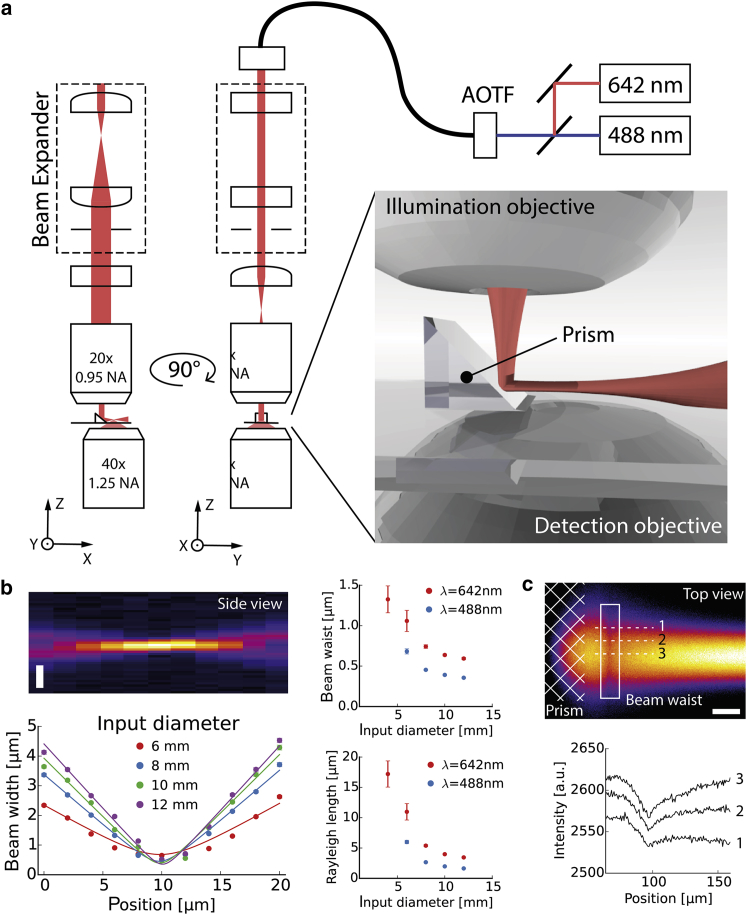
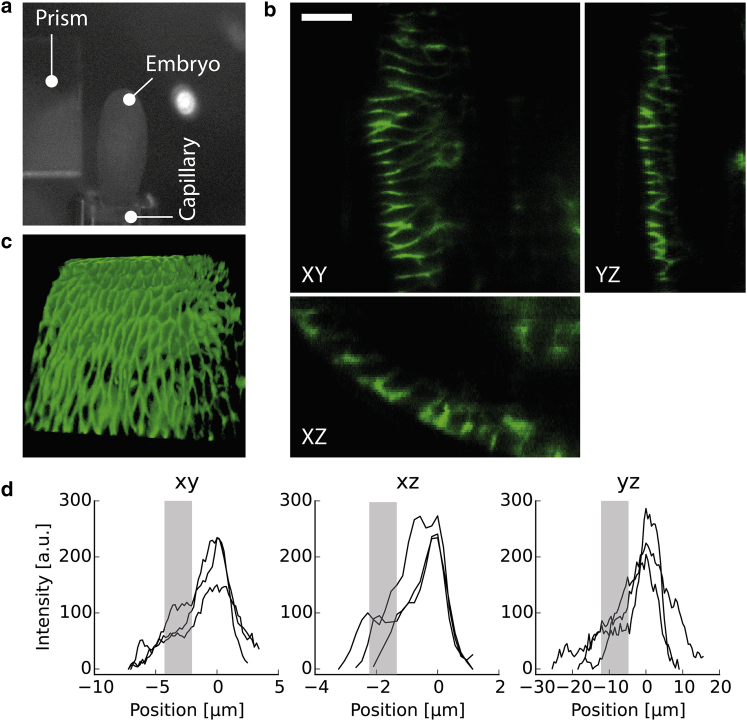
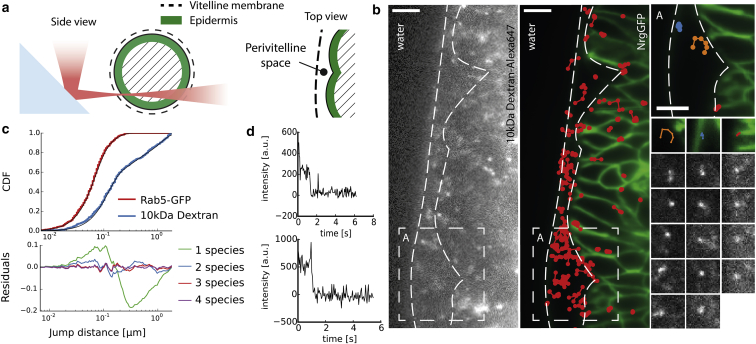
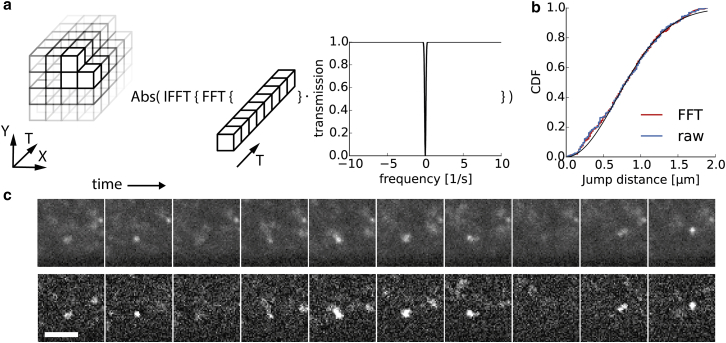
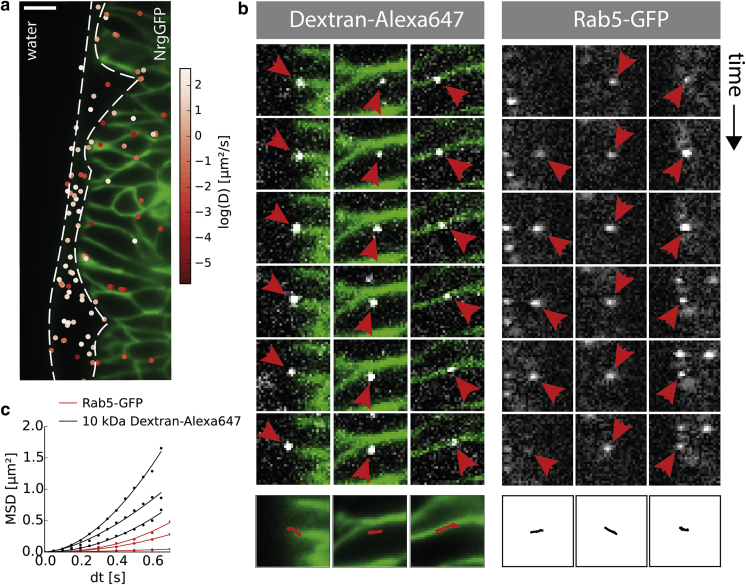
In multicellular organisms, single-fluorophore imaging is obstructed by high background. To achieve a signal/noise ratio conducive to single-molecule imaging, we adapted reflected light-sheet microscopy (RLSM) to image highly opaque late-stage Drosophila embryos. Alignment steps were modified by means of commercially available microprisms attached to standard coverslips. We imaged a member of the septate-junction complex that was used to outline the three-dimensional epidermal structures of Drosophila embryos. Furthermore, we show freely diffusing single 10 kDa Dextran molecules conjugated to one to two Alexa647 dyes inside living embryos. We demonstrate that Dextran diffuses quickly (∼6.4 μm(2)/s) in free space and obeys directional movement within the epidermal tissue (∼0.1 μm(2)/s). Our single-particle-tracking results are supplemented by imaging the endosomal marker Rab5-GFP and by earlier reports on the spreading of morphogens and vesicles in multicellular organisms. The single-molecule results suggest that RLSM will be helpful in studying single molecules or complexes in multicellular organisms.


Figures

Figure 1
Figure 1
Optical setup. (a) Schematic depicting the optical setup of our reflected-light-sheet microscope (RLSM). The 642 nm and 488 nm laser lines are modulated via AOTF and coupled into the optical system. A cylindrical beam expander forms an elliptical beam profile that is dynamically controlled by the beam input diameter. The third cylindrical lens conjugates the back focal plane of the illumination objective. The light sheet is reflected via a microprism onto the focal plane of a high-NA detection objective. The setup is illustrated from two different directions to highlight the elliptical beam geometry. (b) Raw data for the measured light-sheet profile along the propagation direction every 2 μm without reflection at 488 nm. Vertical scale bar, 2 μm. Gaussian beam propagation and fits are shown for 488 nm and four different beam input diameters. Beam waist and Rayleigh length were extracted from fits for both wavelengths. (c) Imaging of the light sheet after reflection of the microprism in Cy5 in water. Line profiles are shown for three different positions along the light-sheet width. Scale bar, 40 μm.
Figure 2
Figure 2
Volume imaging. (a) Positioning of Drosophila embryo with a capillary in front of the microprism’s reflective surface. A motorized linear actuator moved the capillary and the embryo in the z-direction. (b) Orthogonal views of images acquired with 0.5 μm resolution along the z-direction. Scale bar, 10 μm. NrgGFP accumulates at the apicolateral site of epithelial cells to hinder free diffusion along the paracellular space. (c) Reconstructed 3D volume of the epidermal structure. Single cells were readily resolved with RLSM. The ∼1 μm light-sheet thickness for optimal single-molecule imaging is accompanied by a limited region of homogeneous illumination (Fig. 1, b and c). Thus, we restricted the 3D volume imaging on the outer epidermal layer. (d) Line profiles along the cell-cell junction reveal an ∼2-fold increase in the NrgGFP signal at the apicolateral site (0 μm) compared to what we found at the basolateral site (gray bar) in all three directions of space.
Figure 3
Figure 3
Single-molecule detection and tracking. (a) Illustration of the excitation path and cross section of the embryo at the region of interest. Imaging at the lower left quadrant of the embryo reduced optical aberrations. (b) Single raw image of 10 kDa Dextran-Alexa647 and the temporal average of NrgGFP with superimposed trajectories. Scale bar, 10 μm. Subregion and tracks show examples for fast (left), medium (center), and slow (right) particles. Scale bar, 5 μm. (c) Cumulative distribution function (CDF) of jump distances pooled from three different embryos and a three-component fitted model. Additionally, the CDF and a fitted curve (two-component model) are shown for Rab5-GFP particles found in the Drosophila embryo. (d) Example of Alexa647 bleaching steps found during the first seconds of imaging with the 642 nm laser line.
Figure 4
Figure 4
FFT filtering. (a) Every pixel in the image stack was independently processed using the temporal FFT filter. A Gaussian window was applied to remove immobile fraction and bleaching kinetics to improve the automatic spot detection. (b) CDF of freely diffusing 46-nm-diameter beads before and after FFT filtering. (c) Sequences of single frames of freely diffusing 10 kDa Dextran-Alexa647 in Drosophila embryos are shown for unfiltered (upper row) and filtered (lower row) movies. Scale bar, 5 μm. To see this figure in color, go online.
Figure 5
Figure 5
Spatial heterogeneity of diffusion. (a) Superimposed mean track position with color-coded apparent diffusion coefficient. The apparent diffusion coefficient was calculated for all equally spaced time lags of 50 ms along entire individual trajectories. Fast diffusion coefficients are mainly found in the perivitelline space. In contrast, slow particles are mostly found in the paracellular space or at the cell cortex of epidermal cells. Scale bar, 10 μm. (b) Six representative time-lapse image sequences for particles associated with Dextran-Alexa647 (left three columns, green, NrgGFP) and Rab5-GFP (right three columns), with directional movement indicated by arrowheads. (c) Tracks were extracted and MSD curves reveal an anomalous diffusion coefficient of α > 1.

References

    1. Li G.-W., Xie X.S. Central dogma at the single-molecule level in living cells. Nature. 2011;475:308–315. - PMC - PubMed
    1. Ulbrich M.H., Isacoff E.Y. Subunit counting in membrane-bound proteins. Nat. Methods. 2007;4:319–321. - PMC - PubMed
    1. Zhan H., Stanciauskas R., Pinaud F. In vivo single-molecule imaging identifies altered dynamics of calcium channels in dystrophin-mutant C. elegans. Nat. Commun. 2014;5:4974. - PMC - PubMed
    1. Tokunaga M., Imamoto N., Sakata-Sogawa K. Highly inclined thin illumination enables clear single-molecule imaging in cells. Nat. Methods. 2008;5:159–161. - PubMed
    1. Huisken J., Swoger J., Stelzer E.H. Optical sectioning deep inside live embryos by selective plane illumination microscopy. Science. 2004;305:1007–1009. - PubMed

Publication types

LinkOut - more resources