. 2016 Mar 22;7(12):14898-911.
doi: 10.18632/oncotarget.7469.

APG101 efficiently rescues erythropoiesis in lower risk myelodysplastic syndromes with severe impairment of hematopoiesis

Affiliations

APG101 efficiently rescues erythropoiesis in lower risk myelodysplastic syndromes with severe impairment of hematopoiesis

Anna Raimbault et al. Oncotarget. .

Abstract

CD95, a member of the death receptor family initiates a caspase-dependent apoptosis, when activated by its ligand CD95L, thought to negatively regulate erythrocyte production in the bone marrow. We have previously shown that CD95 is overexpressed in two thirds of patients with a lower risk myelodysplastic syndrome (MDS) and that resistance to erythropoiesis-stimulating agents (ESA) is linked to poor residual erythropoiesis. In the present study, we show that CD95 overexpression and previous transfusion are independent predictive factors of ESA resistance. To investigate an alternative therapeutic strategy of anemia in ESA-resistant patients, we have conducted a preclinical study of the effects of APG101, a fusion protein consisting of the extracellular domain of human CD95 and the Fc region of human IgG1 on MDS erythropoiesis in vitro. APG101 increases the number of burst-forming unit-erythroid (BFU-E) progenitors derived from CD34+ progenitors in liquid culture and improves overall proliferation rate of erythroid precursors by inhibiting apoptosis. APG101 rescues BFU-E growth in MDS patients presenting with attrition of erythroid progenitors at baseline, independently of CD95 or CD95L expression level. Our data show that overexpression of CD95 at diagnosis is a hallmark of ESA resistance and that severe impairment of erythropoiesis is predictive of erythroid response to APG101 in vitro. These data provide a rationale for further clinical investigation of APG101 in an attempt to treat anemia in lower risk MDS patients.

Keywords: CD95; CD95 ligand; anemia; erythropoiesis; myelodysplastic syndromes.


Conflict of interest statement

CONFLICTS OF INTEREST

Anna Raimbault, Celine Deudon, Cecile Pierre-Eugene, Lise Willems, Nicolas Chapuis, Stephanie Mathis, Alexandra Rouquette, Olivier Kosmider, Valerie Bardet have nothing to disclose. Claudia Kunz, and Harald Fricke are APOGENIX employees. Michaela Fontenay received research funding from APOGENIX.

Figures

Figure 1
Figure 1
A. Membrane CD95 expression in MDS bone marrow. CD95 expression was quantified in the CD45low cell population by flow cytometry. Results as ratios of fluorescence intensity (RFI) in 30 controls and 192 patients including 162 low/int-1 and 30 int-2/high MDS. B. Membrane expression of CD95 ligand (CD95L) in MDS bone marrows. CD95L expression was quantified in the CD45low cell population. Results as RFI in 41 low/in-1 and 9 int-2/high MDS patients and 18 controls. Box plots with horizontal bars indicating the median and 1st and 99th centiles. Unpaired Student t-test or Mann-Whitney-test for P values.
Figure 2
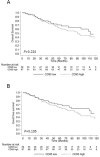
Figure 2. Impact of CD95 expression on survival and event-free survival
A. Overall survival according to CD95 RFI in 153 MDS patients. B. Event-free survival according to CD95 RFI. Data are plotted as a Kaplan-Meier curve. Log Rank test for P values.
Figure 3
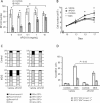
Figure 3. APG 101 improves the proliferation of erythroid progenitors of BFU-E type and of erythroid precursors by inhibiting apoptosis
Erythroblasts were derived from CD34+ progenitors in liquid culture (controls, n=3; MDS, n=5 including 2 RA, 2 RCMD, 1 RARS). A. Cells were harvested at day 5 of the culture and seeded at 104 cells/mL in the presence of increasing concentrations of APG101 in methylcellulose medium for colony assays. BFU-E were quantified after 10 days. Controls plotted as white bars, MDS as gray bars. B. APG101 (10 μg/mL) was added and renewed every two days from day 10 to 17. Amplification rate was evaluated by cell counting every two days. Controls as dotted lines, MDS as full lines. C. Erythroid cell differentiation was assessed at day 12 by cytological examination of May-Grünwald-Giemsa-stained cytospins (left panel) or by flow cytometry using a double labeling with CD71 and CD235a to glycophorin A (GPA) antibodies (right panel). Results are representative of 3 experiments. D. Apoptosis was quantified in CD71+ GPA and CD71+ GPA+ cell populations by flow cytometry in 5 cases of MDS and 3 controls. Results expressed as means ± SEM. Mann-Whitney test for P values. *: < 0.05.
Figure 4
Figure 4. Effects of APG101 on the growth of hematopoietic progenitors
Bone marrow mononuclear cells (3 5q- syndrome, 3 RA, 1 RARS, 2 RCMD-RS, 5 RCMD, 6 RAEB1, 5 controls). were seeded at 105 cells/mL in methylcellulose medium in the presence of increasing concentrations of APG101. BFU-E and CFU-GM were counted at day 14 and CFU-E and CFU-L were counted at day 7. “Low” MDS (n=15) were defined as MDS with a significant lower BFU-E number compared to controls, and “normal” MDS (n=5) were defined as MDS with a BFU-E number equivalent to controls. Results are expressed as colony numbers. Horizontal bars represent medians and 1st and 99th centiles. Kruskal-Wallis test for P values.
Figure 5
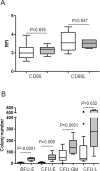
Figure 5. Low progenitor cell number, but not CD95 or CD95L expression at baseline is predictive of the response to APG101
A. CD95 and CD95L were quantified by flow cytometry and expressed as RFI. B. Bone marrow mononuclear cells were seeded at 105 cells/mL in methylcellulose. BFU-E and CFU-GM were counted after 14 days and CFU-E and CFU-L were counted after 7 days. Results are expressed as colony numbers. White boxes for responders and gray boxes for non-responders. Horizontal bars represent medians and 1st and 99th centiles. Student t-test for P values.

Similar articles

Cited by

References

    1. Krammer PH, Behrmann I, Daniel P, Dhein J, Debatin KM. Regulation of apoptosis in the immune system. Curr Opin Immunol. 1994;6:279–289. Review. - PubMed
    1. De Maria R, Zeuner A, Eramo A, Domenichelli C, Bonci D, Grignani F, Srinivasula SM, Alnemri ES, Testa U, Peschle C. Negative regulation of erythropoiesis by caspase-mediated cleavage of GATA-1. Nature. 1999;401:489–493. - PubMed
    1. Koulnis M, Liu Y, Hallstrom K, Socolovsky M. Negative autoregulation by Fas stabilizes adult erythropoiesis and accelerates its stress response. PLoS One. 2011;6:e21192. - PMC - PubMed
    1. Claessens YE, Bouscary D, Dupont JM, Picard F, Melle J, Gisselbrecht S, Lacombe C, Dreyfus F, Mayeux P, Fontenay-Roupie M. In vitro proliferation and differentiation of erythroid progenitors from patients with myelodysplastic syndromes: evidence for Fas-dependent apoptosis. Blood. 2002 Mar 1;99:1594–601. - PubMed
    1. Claessens YE, Park S, Dubart-Kupperschmitt A, Mariot V, Garrido C, Chrétien S, Dreyfus F, Lacombe C, Mayeux P, Fontenay M. Rescue of early-stage myelodysplastic syndrome-deriving erythroid precursors by the ectopic expression of a dominant-negative form of FADD. Blood. 2005 May 15;105:4035–42. - PubMed

MeSH terms