. 2016 Feb 25:6:21437.
doi: 10.1038/srep21437.

Imaging trace element distributions in single organelles and subcellular features

Affiliations

Imaging trace element distributions in single organelles and subcellular features

Yoav Kashiv et al. Sci Rep. .

Abstract

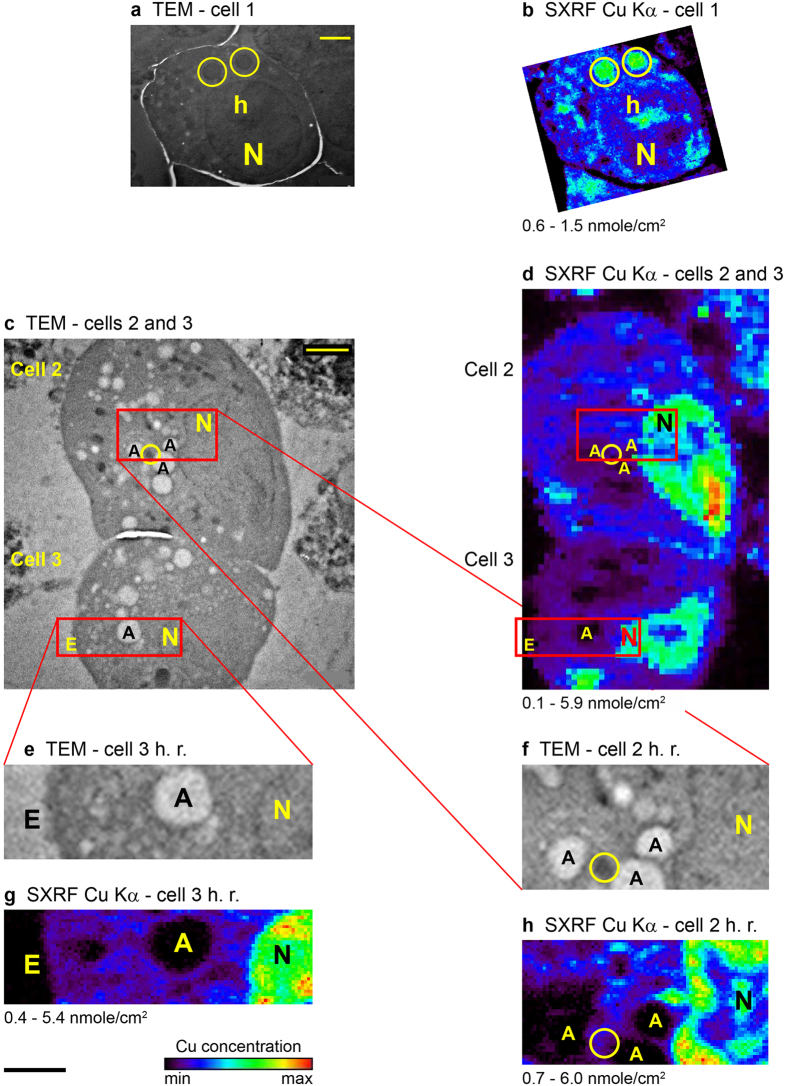
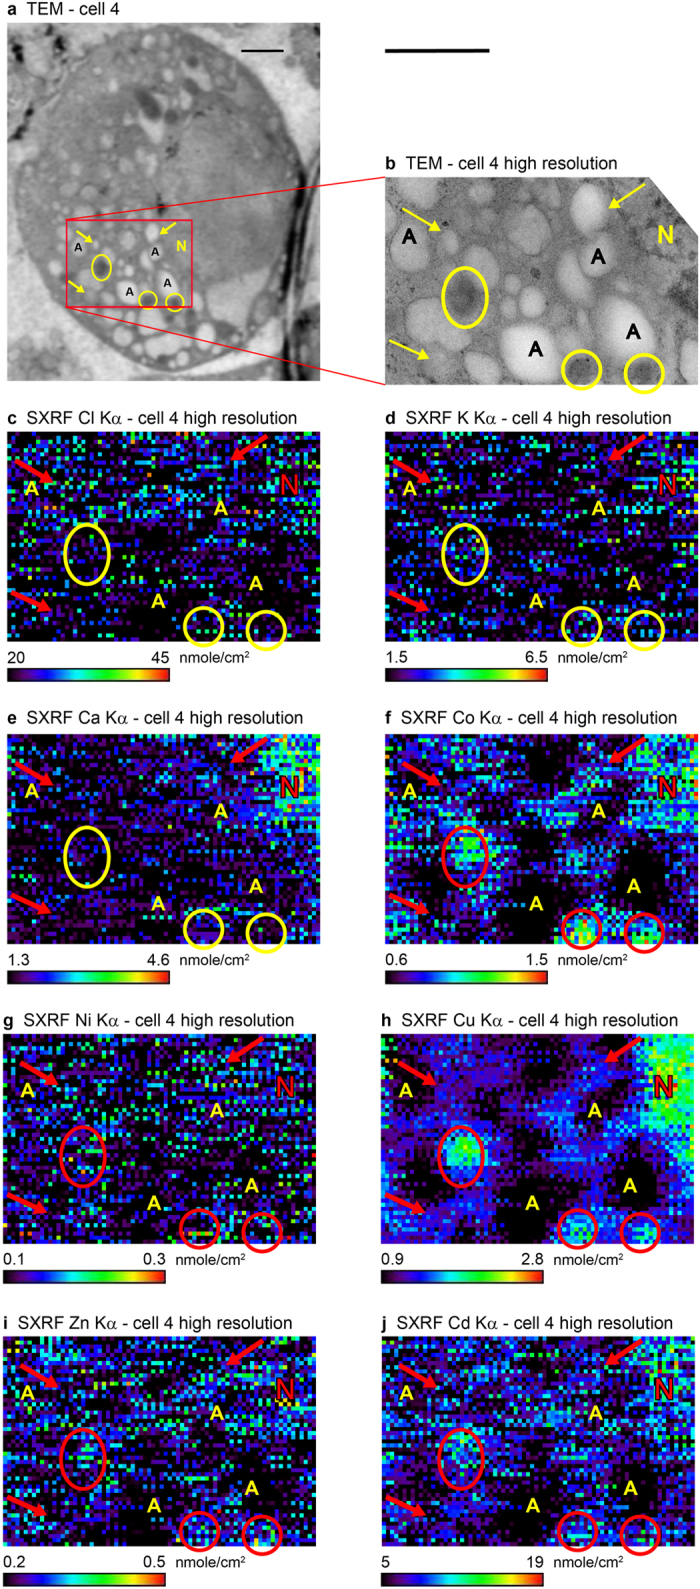
The distributions of chemical elements within cells are of prime importance in a wide range of basic and applied biochemical research. An example is the role of the subcellular Zn distribution in Zn homeostasis in insulin producing pancreatic beta cells and the development of type 2 diabetes mellitus. We combined transmission electron microscopy with micro- and nano-synchrotron X-ray fluorescence to image unequivocally for the first time, to the best of our knowledge, the natural elemental distributions, including those of trace elements, in single organelles and other subcellular features. Detected elements include Cl, K, Ca, Co, Ni, Cu, Zn and Cd (which some cells were supplemented with). Cell samples were prepared by a technique that minimally affects the natural elemental concentrations and distributions, and without using fluorescent indicators. It could likely be applied to all cell types and provide new biochemical insights at the single organelle level not available from organelle population level studies.


Figures

Figure 1
Figure 1. Complementary TEM and SXRF micro/nanoprobe Cu Kα distribution maps of MIN6 cells 1–3.
The combined information from the two imaging techniques gives a detailed ultrastructural and chemical picture of the subcellular environment at the single organelle level. (a) TEM map of cell 1. This cell was grown in a medium with no Cd. It serves as a reference for the sample preparation and imaging procedure we used. Scale bar = 2 μm. (b) The corresponding SXRF microprobe map to a. Scan step size = 0.1 μm, dwell time = 1 s. Same scale as a. The two Au nanoparticles that are seen in the map, as red pixels in the upper and lower left parts, are off the reported concentration range. (c) TEM image of cells 2 and 3. These cells were grown in a medium supplemented with 1 μmole/l CdCl2. Red rectangles outline the areas imaged with the SXRF nanoprobe at high-resolution. Scale bar = 2 μm. (d) The SXRF microprobe map corresponding to c. Scan step size = 0.25 μm, dwell time = 1 s. Same scale as c. (e–f) Enlargements of the high-resolution (h. r.) scan areas in the TEM image of cells 3 and 2 (c), respectively. (g–h) The SXRF nanoprobe maps corresponding to e–f. Scan step size = 0.05 μm, dwell time = 5 s. One μm scale bar (below g) applies to (e–h). Elemental spatial density scale bar (below g) applies to (b,d,gh) and the measured range, in units of nmole/cm2, is indicated below each map. Contrast of the SXRF images (b,d,gh) has been enhanced. A – autophagosome-like feature, E – edge of the cell, h – heterochromatin, N – nucleus, circles outline mitochondria. Additional concentration information, including uncertainties, appears in Supplementary Table S2.
Figure 2
Figure 2. Complementary TEM and SXRF nanoprobe images of MIN 6 cell 4.
The cell was grown in a medium supplemented with 1 μmole/l CdCl2. (Compare with untreated cell 5, Supplementary Fig. S1, Table S3). In this case, the 350 nm thick cell section was mounted on a non-coated Au TEM finder grid and was sandwiched between two Formvar layers (each ~100 nm thick). (a) TEM image of the cell. The red rectangle outlines the area imaged with the SXRF nanoprobe. Scale bar = 1 μm. (b) Enlargement of the high-resolution scan area in the TEM image a. (c–j) SXRF nanoprobe elemental distribution maps corresponding to b of, respectively, Cl, K, Ca, Co, Ni, Cu, Zn, Cd. All elemental spectra were collected simultaneously. With the exception of Cd, all elements were mapped by their Kα lines. Cadmium was mapped by its Lα lines. Scan step size = 0.04 μm, dwell time = 8 s. One μm scale bar (above b) applies to (b–j). Elemental spatial density scale bar with the measured range, in units of nmole/cm2, appears below each elemental map. Contrast of the SXRF images (c–j) has been enhanced. The Cl concentration, Kα1,2 = 2.622, 2.621 keV, respectively, in c may be overestimated due to the presence of an unidentified strong line at ~2.400 keV. Due to lack of suitable Cd standard, there could be a systematic uncertainty of up to a factor of 2 in the inferred Cd concentrations (j, see Methods). A – autophagosome-like feature, N – nucleus, arrows point to vesicles, potentially insulin producing, circles/ellipses outline mitochondria. Additional concentration information, including uncertainties, appears in Supplementary Table S2.

References

    1. Lee S. M., Chen H., Dettmer C. M., O’Halloran T. V. & Nguyen S. T. Polymer-caged lipsomes: a pH-responsive delivery system with high stability. Journal of the American Chemical Society 129, 15096–15097 (2007). - PubMed
    1. Davis A. V. & O’Halloran T. V. A place for thioether chemistry in cellular copper ion recognition and trafficking. Nat Chem Biol 4, 148–151 (2008). - PMC - PubMed
    1. Kim B. E., Nevitt T. & Thiele D. J. Mechanisms for copper acquisition, distribution and regulation. Nat Chem Biol 4, 176–185 (2008). - PubMed
    1. El Muayed M. et al.. Acute cytokine-mediated downregulation of the zinc transporter ZnT8 alters pancreatic beta-cell function. The Journal of endocrinology 206, 159–169 (2010). - PMC - PubMed
    1. Kim A. M., Vogt S., O’Halloran T. V. & Woodruff T. K. Zinc availability regulates exit from meiosis in maturing mammalian oocytes. Nat Chem Biol 6, 674–681 (2010). - PMC - PubMed

Publication types

MeSH terms

LinkOut - more resources