

A unified theory for the energy cost of legged locomotion
- PMID: 26911339
- PMCID: PMC4780550
- DOI: 10.1098/rsbl.2015.0935
A unified theory for the energy cost of legged locomotion
Erratum in
-
Correction: 'A unified theory for the energy cost of legged locomotion' (2016), by Pontzer.Biol Lett. 2023 Dec;19(12):20230492. doi: 10.1098/rsbl.2023.0492. Epub 2023 Dec 13. Biol Lett. 2023. PMID: 38098434 Free PMC article. No abstract available.
Abstract
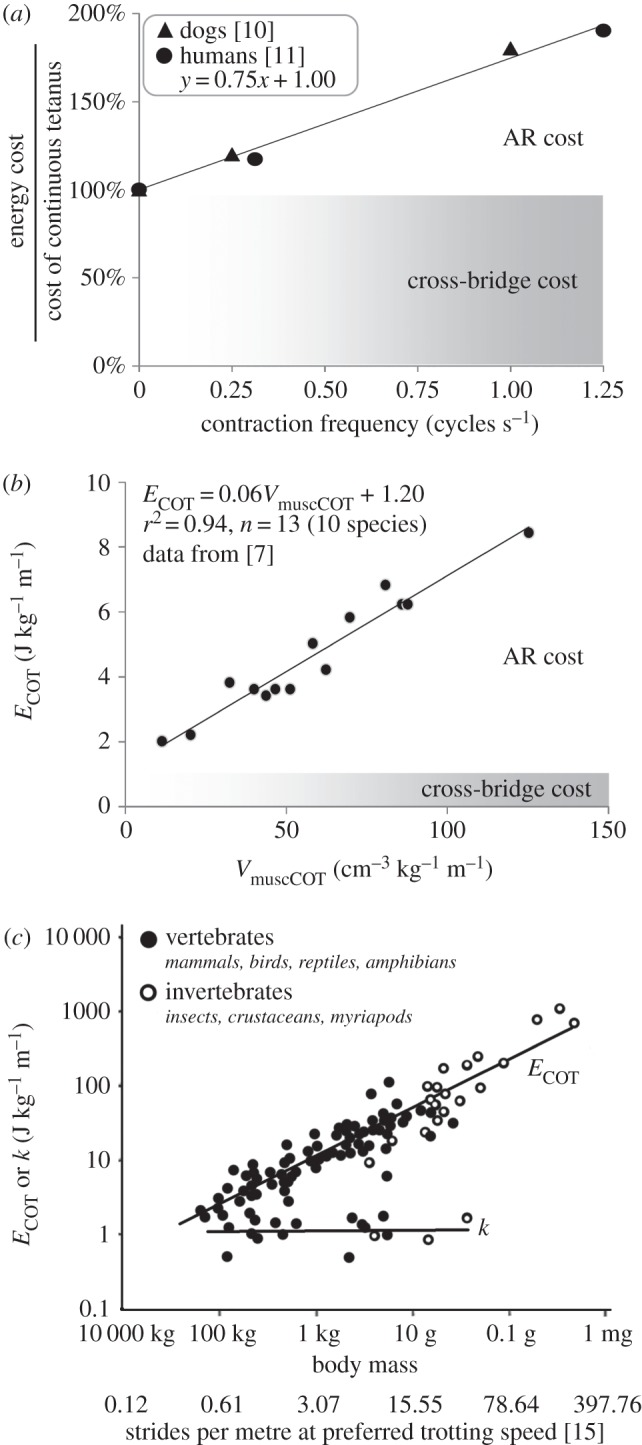
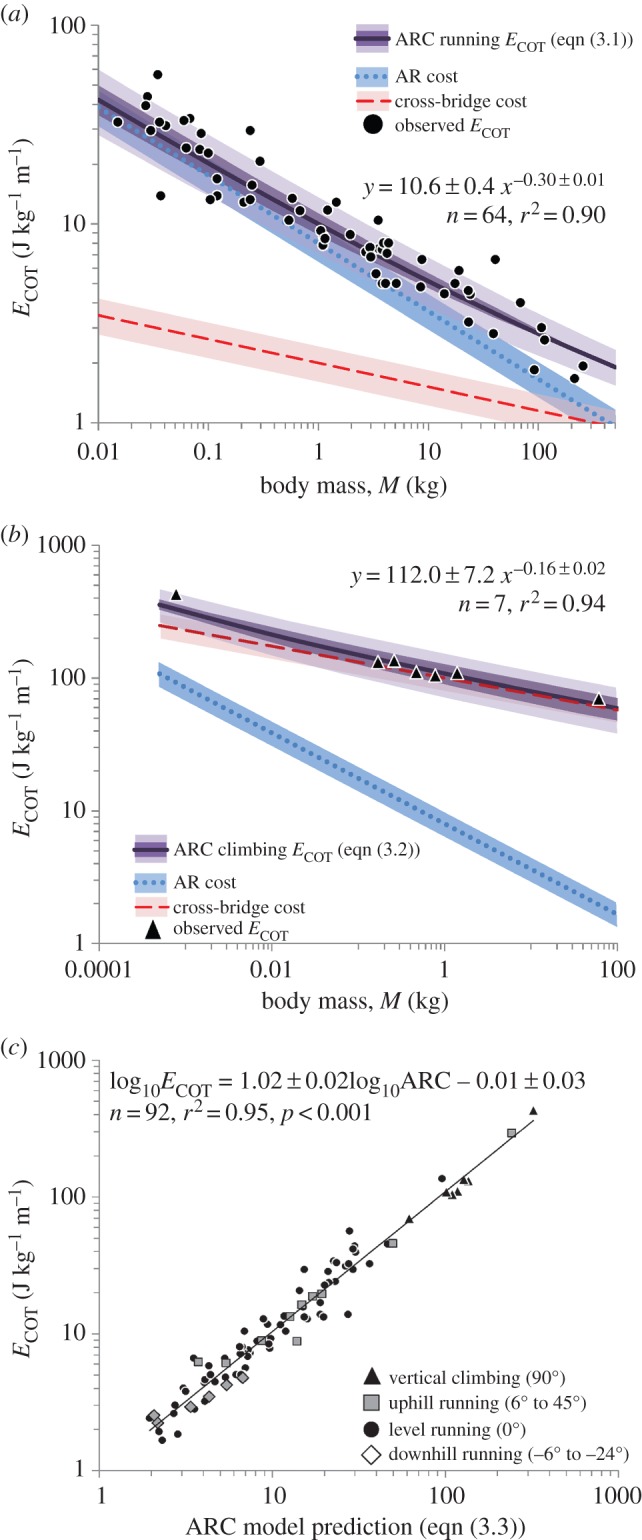
Small animals are remarkably efficient climbers but comparatively poor runners, a well-established phenomenon in locomotor energetics that drives size-related differences in locomotor ecology yet remains poorly understood. Here, I derive the energy cost of legged locomotion from two complementary components of muscle metabolism, Activation-Relaxation and Cross-bridge cycling. A mathematical model incorporating these costs explains observed patterns of locomotor cost both within and between species, across a broad range of animals (insects to ungulates), for a wide range of substrate slopes including level running and vertical climbing. This ARC model unifies work- and force-based models for locomotor cost and integrates whole-organism locomotor cost with cellular muscle physiology, creating a predictive framework for investigating evolutionary and ecological pressures shaping limb design and ranging behaviour.
Keywords: biomechanics; energetics; locomotion.
© 2016 The Author(s).
Figures
References
-
- Heglund NC, Fedak MA, Taylor CR, Cavagna GA. 1982. Energetics and mechanics of terrestrial locomotion. IV. Total mechanical energy changes as a function of speed and body size in birds and mammals. J. Exp. Biol. 97, 57–66. - PubMed
-
- Full RJ, Tu MS. 1991. Mechanics of a rapid running insect: two-, four- and six-legged locomotion. J. Exp. Biol. 156, 215–231. - PubMed
-
- Willems PA, Cavagna GA, Heglund NC. 1995. External, internal and total work in human locomotion. J. Exp. Biol. 198, 379–393. - PubMed
Publication types
MeSH terms
Grants and funding
LinkOut - more resources
Full Text Sources
Other Literature Sources