Comparative Study
. 2016 May 1;25(9):1714-27.
doi: 10.1093/hmg/ddw043. Epub 2016 Feb 23.

Global hypermethylation in fetal cortex of Down syndrome due to DNMT3L overexpression

Affiliations
Comparative Study

Global hypermethylation in fetal cortex of Down syndrome due to DNMT3L overexpression

Jie Lu et al. Hum Mol Genet. .

Abstract

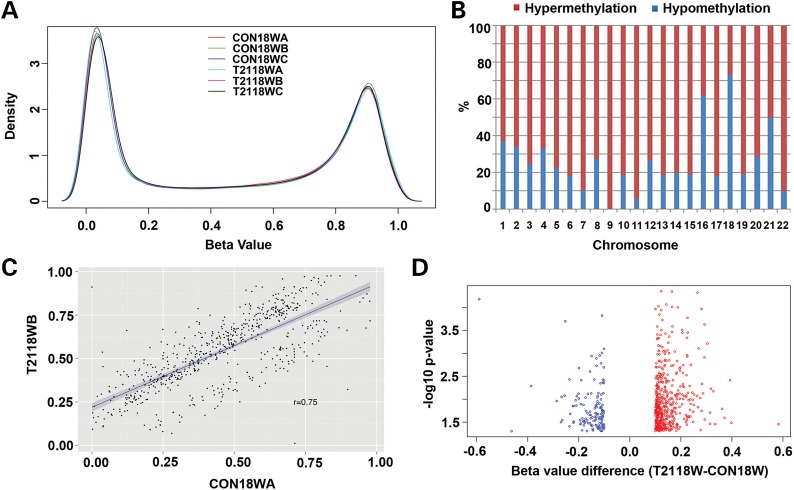
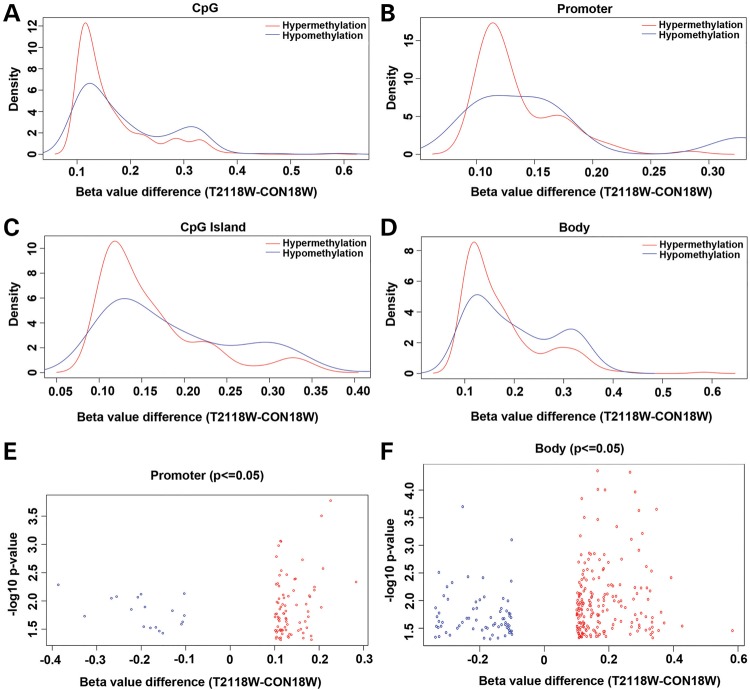
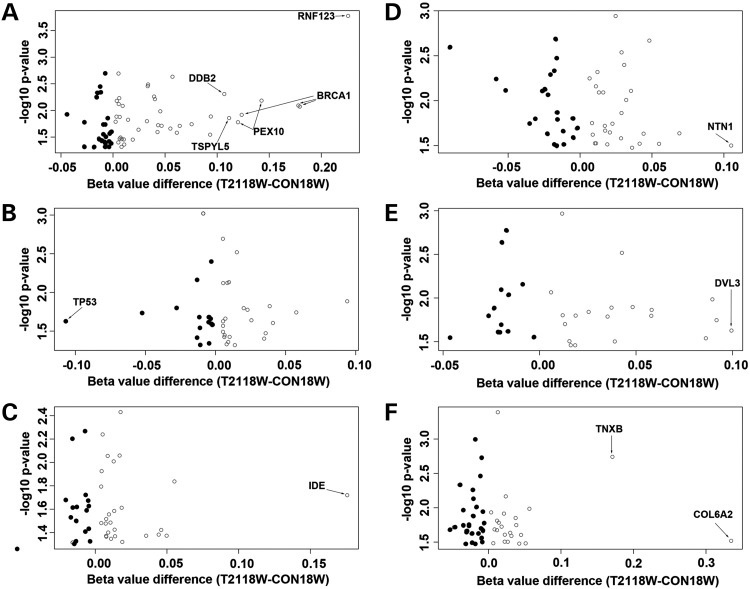
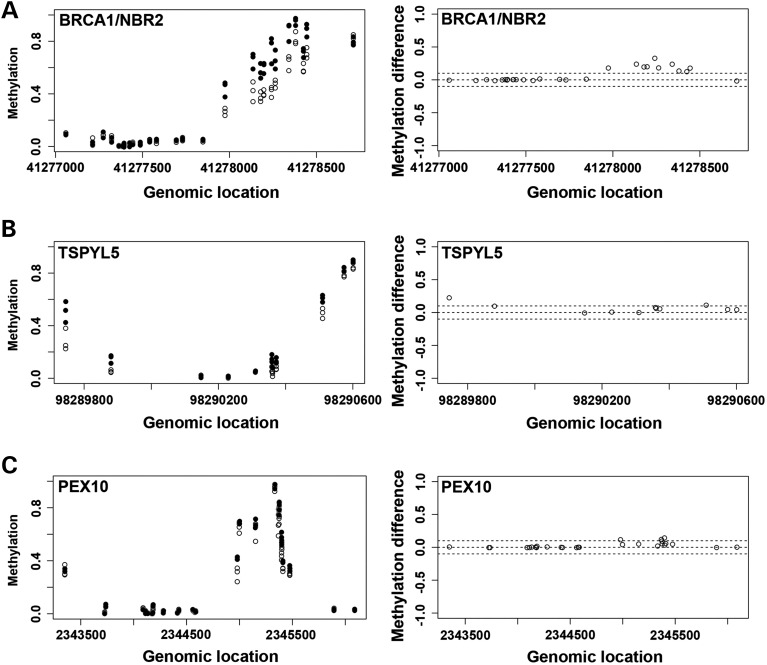
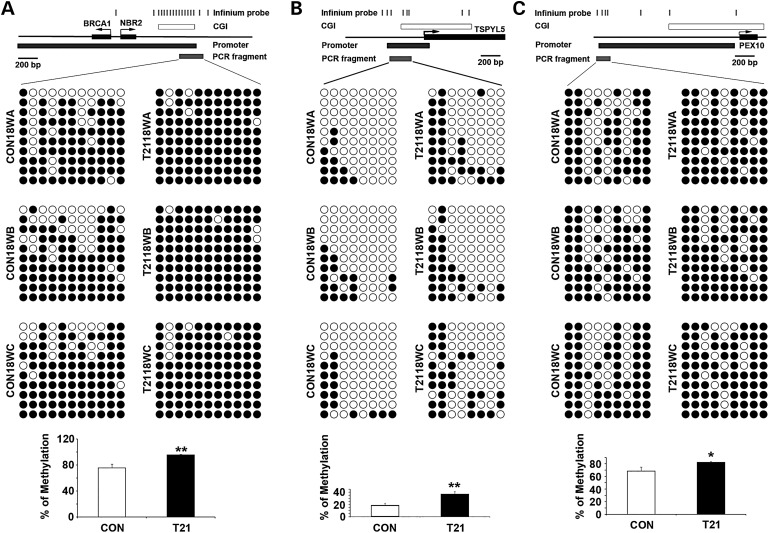
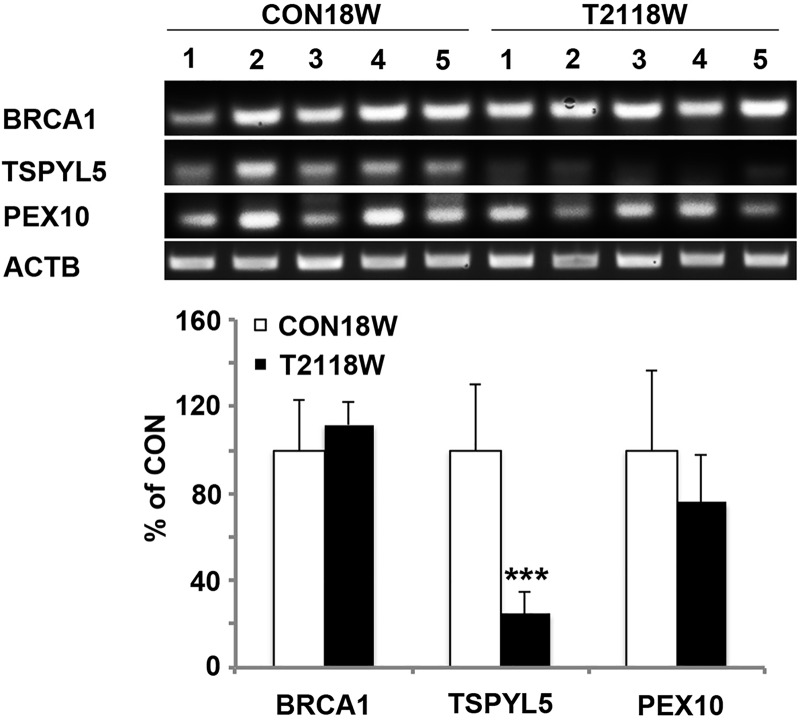
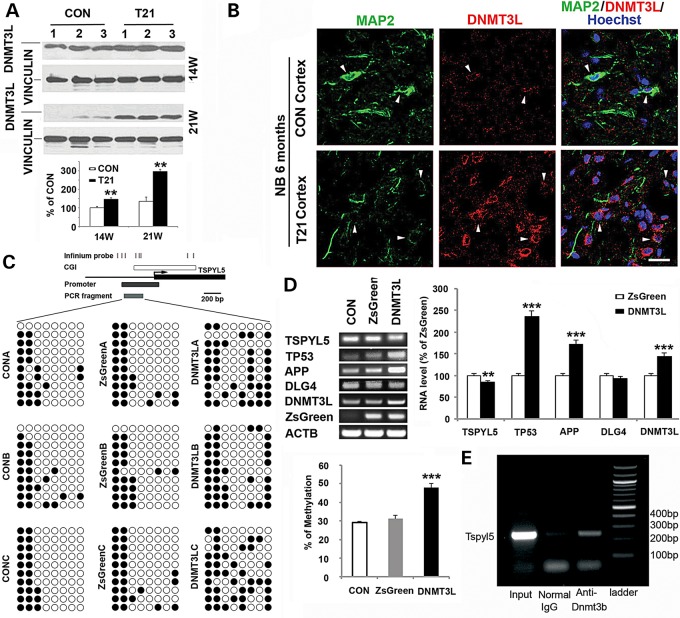
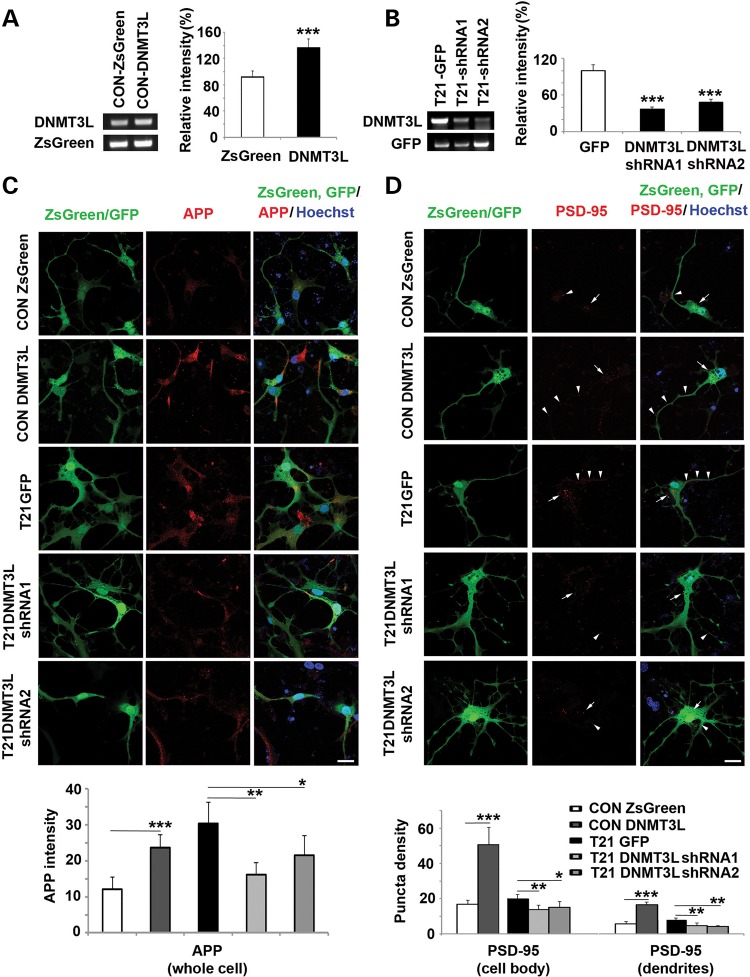
Down syndrome (DS) is caused by a triplication of chromosome 21 (HSA21). Increased oxidative stress, decreased neurogenesis and synaptic dysfunction from HSA21 gene overexpression are thought to cause mental retardation, dementia and seizure in this disorder. Recent epigenetic studies have raised the possibility that DNA methylation has significant effects on DS neurodevelopment. Here, we performed methylome profiling in normal and DS fetal cortices and observed a significant hypermethylation in ∼4% of probes in the DS samples compared with age-matched normals. The probes with differential methylation were distributed across all chromosomes, with no enrichment on HSA21. Functional annotation and pathway analyses showed that genes in the ubiquitination pathway were significantly altered, including: BRCA1, TSPYL5 and PEX10 HSA21 located DNMT3L was overexpressed in DS neuroprogenitors, and this overexpression increased the promoter methylation of TSPYL5 potentially through DNMT3B, and decreased its mRNA expression. DNMT3L overexpression also increased mRNA levels for TP53 and APP, effectors of TSPYL5 Furthermore, DNMT3L overexpression increased APP and PSD95 expression in differentiating neurons, whereas DNMT3LshRNA could partially rescue the APP and PSD95 up-regulation in DS cells. These results provide some of the first mechanistic insights into causes for epigenetic changes in DS, leading to modification of genes relevant for the DS neural endophenotype.


Figures

Figure 1.
Figure 1.
Global hypermethylation in T21 fetal cortical DNA samples. (A) A density plot demonstrates the distribution of the DNA methylation level (β-value) for 410 876 probes in three CON (CON18WA, CON18WB and CON18WC) and three T21 (T2118WA, T2118WB and T2118WC) cases, which shows bimodally distributed methylation levels enriching highly methylated (≥0.75) and unmethylated (≤0.25) probes. (B) A percentage chart demonstrates the distribution of hypermethylation and hypomethylation in differential methylated probes of T2118W and CON18W comparison on 22 auto chromosomes (P-value ≤ 0.05, β-value difference ≥ 0.1), which shows more hypermethylation than hypomethylation in all chromosomes except chromosome 16, 18 and 21. (C) A correlation plot of β-value between CON18W and T2118W cases, with a correlation coefficient of 0.75, showing the significant difference of the two groups (P-value ≤ 0.05, β-value difference ≥ 0.1). (D) A volcano plot demonstrates the distribution of differential methylated probes of T2118W and CON18W with P-value levels, showing more hypermethylation (red circles) than hypomethylation (blue circles).
Figure 2.
Figure 2.
Distribution of differential DNA methylation in different regions of genome. Density plots demonstrate similar pattern on the distribution of differential DNA methylation (β-value difference) between T2118W and CON18W cases (P-value ≤ 0.05, β-value difference ≥ 0.1) in CpG sites (A), promoter (B), CpG island (C) and body (D). Most methylation changes occur between 10 and 20% for all groups. The distribution of differential DNA methylation was also shown with two volcano plots for promoter (E) and body (F).
Figure 3.
Figure 3.
The distribution of differential DNA methylation in different KEGG pathways Volcano plots demonstrate the distribution of differential methylated probes between T2118W and CON18W (P-value ≤ 0.05, promoter-associated) with P-value levels in ubiquitin proteolysis pathway (A), cell cycle pathway (B) and AD pathway (C). The same analyses with the data set that have a P-value of ≤0.05, and are gene body-associated show the distribution of differential methylated probes between T2118W and CON18W in axon guidance pathway (D), Notch signaling pathway (E) and ECM-receptor interaction pathway (F). Probes with >10% change are labeled with gene names. Most changes are <10%, and there are more hypermethylation (open circles) than hypomethylation (filled circles).
Figure 4.
Figure 4.
Probes clusters showing hypermethylation in three genes on ubiquitin proteolysis pathway. Plots demonstrate the distribution of DNA methylation levels and methylation difference (β-value difference) between T2118W (filled circle) and CON18W (open circle) along the genomic locations for the probes clusters on BRCA1/NBR2 (A), TSPYL5 (B) and PEX10 (C) in ubiquitin proteolysis pathway. These cluster changes are pulled out by bumphunter. The dash line indicates the levels of methylation difference at 0.1 and −0.1.
Figure 5.
Figure 5.
Bisulfite sequencing confirming hypermethylation in three genes on ubiquitin proteolysis pathway. Bisulfite sequencing results of BRCA1/NBR2 (A), TSPYL5 (B) and PEX10 (C) demonstrate increased DNA methylation in T2118W compared with CON18W cases. The aligned circles stand for CpG sites tested (white: unmethylated and black: methylated). The above maps show the locations of significant Infinium probes, CpG island (CGI), promoter and PCR fragment along the genome for each gene. The graph below show the statistic difference of the methylation changes (*P ≤ 0.05 and **P ≤ 0.01).
Figure 6.
Figure 6.
mRNA changes in three genes on ubiquitin proteolysis pathway. Semi-quantitative RT-PCR demonstrates the mRNA levels of BRCA1 (A), TSPYL5 (B) and PEX10 (C) in five CON18W and five T2118W cases, with significant down-regulation in TSPYL5. The quantification is shown below (***P ≤ 0.001).
Figure 7.
Figure 7.
DNMT3L overexpression causes hypermethylation of TSPYL5 gene, and down-regulation of its mRNA expression DNMT3L is significantly up-regulated in 14W and 21W of T21 frontal cortex shown by western blot (A) and in 6-month-old newborn T21 patient shown by immunofluorescence, with DNMT3L (Cy3) and MAP2 (Cy2) double staining (B). Bisulfite sequencing results of TSPYL5 demonstrate increased DNA methylation in DNMT3L overexpressed HNPs 3d after the lentiviral infection (C). The aligned circles stand for CpG sites tested (white: unmethylated and black: methylated). The above map shows the locations of significant Infinium probes, CpG island (CGI), promoter and PCR fragment along the genome for TSPYL5. The graph on the right shows the statistic difference of the methylation changes (***P ≤ 0.001). Semi-quantitative RT-PCR demonstrates the mRNA changes in TSPYL5, TP53, APP and DLG4 after DNMT3L overexpression in CON HNPs 3d after the lentiviral infection (D). The quantification graph is below (***P ≤ 0.001). (E) Chromatin immunoprecipitation assay demonstrates that DNMT3B interacts with the promoter site of TSPYL5. Antibodies to Dnmt3b are able to pull-down the Tspyl5 promoter site, suggesting that DNMT3L could modify Tspyl5 methylation through its effects on Dnmt3b.
Figure 8.
Figure 8.
DNMT3L overexpression increases APP and PSD95 expression in young differentiated neurons. The overexpression of DNMT3L in CON human neurons is confirmed by RT-PCR after the HNPs are infected with lentivirus carrying DNMT3L for 3 days and differentiated into neurons for 7 days (A); and the normalized DNMT3L in T21 human neurons is confirmed by RT-PCR after the T21 HNPs are infected with lentivirus carrying DNMT3LshRNA and differentiated into neurons for 7 days (B). With the same culture and infection protocol as those in (A and B), DNMT3L overexpression can increase APP expression in CON neurons shown by immunofluorescence staining of (Cy3), whereas the overexpression of APP in T21 neurons is down-regulated by DNMT3LshRNA (C). DNMT3L overexpression can increase PSD95 puncta density in cell body (white arrow, Cy3) and dendrites (white arrow head, Cy3), whereas the increased PSD95 puncta density in T21 neurons is down-regulated by DNMT3LshRNA (D). The quantification graphs are below (*P ≤ 0.05, **P ≤ 0.01 and ***P ≤ 0.001). Bar = 25 μm.

References

    1. Lu J., Delli-Bovi L.C., Hecht J., Folkerth R., Sheen V.L. (2011) Generation of neural stem cells from discarded human fetal cortical tissue. J. Vis. Exp., in press. - PMC - PubMed
    1. Esposito G., Imitola J., Lu J., De Filippis D., Scuderi C., Ganesh V.S., Folkerth R., Hecht J., Shin S., Iuvone T. et al. (2008) Genomic and functional profiling of human Down syndrome neural progenitors implicates S100B and aquaporin 4 in cell injury. Hum. Mol. Genet., 17, 440–457. - PubMed
    1. Esposito G., Scuderi C., Lu J., Savani C., De Filippis D., Iuvone T., Steardo L. Jr, Sheen V., Steardo L. (2008) S100B induces tau protein hyperphosphorylation via Dickopff-1 up-regulation and disrupts the Wnt pathway in human neural stem cells. J. Cell. Mol. Med., 12, 914–927. - PMC - PubMed
    1. Lu J., Esposito G., Scuderi C., Steardo L., Delli-Bovi L.C., Hecht J.L., Dickinson B.C., Chang C.J., Mori T., Sheen V. (2011) S100B and APP promote a gliocentric shift and impaired neurogenesis in down syndrome neural progenitors. PLoS One, 6, e22126. - PMC - PubMed
    1. Lu J., Lian G., Zhou H., Esposito G., Steardo L., Delli-Bovi L.C., Hecht J.L., Lu Q.R., Sheen V. (2012) OLIG2 over-expression impairs proliferation of human Down syndrome neural progenitors. Hum. Mol. Gen., 21, 2330–2340. - PMC - PubMed

Publication types

MeSH terms