. 2016 Feb 24;36(8):2458-72.
doi: 10.1523/JNEUROSCI.3484-15.2016.

A Bright and Fast Red Fluorescent Protein Voltage Indicator That Reports Neuronal Activity in Organotypic Brain Slices

Affiliations

A Bright and Fast Red Fluorescent Protein Voltage Indicator That Reports Neuronal Activity in Organotypic Brain Slices

Ahmed S Abdelfattah et al. J Neurosci. .

Erratum in

Abstract

Optical imaging of voltage indicators based on green fluorescent proteins (FPs) or archaerhodopsin has emerged as a powerful approach for detecting the activity of many individual neurons with high spatial and temporal resolution. Relative to green FP-based voltage indicators, a bright red-shifted FP-based voltage indicator has the intrinsic advantages of lower phototoxicity, lower autofluorescent background, and compatibility with blue-light-excitable channelrhodopsins. Here, we report a bright red fluorescent voltage indicator (fluorescent indicator for voltage imaging red; FlicR1) with properties that are comparable to the best available green indicators. To develop FlicR1, we used directed protein evolution and rational engineering to screen libraries of thousands of variants. FlicR1 faithfully reports single action potentials (∼3% ΔF/F) and tracks electrically driven voltage oscillations at 100 Hz in dissociated Sprague Dawley rat hippocampal neurons in single trial recordings. Furthermore, FlicR1 can be easily imaged with wide-field fluorescence microscopy. We demonstrate that FlicR1 can be used in conjunction with a blue-shifted channelrhodopsin for all-optical electrophysiology, although blue light photoactivation of the FlicR1 chromophore presents a challenge for applications that require spatially overlapping yellow and blue excitation.

Keywords: biosensors; fluorescence imaging; fluorescent proteins; genetically encoded indicators; protein engineering; voltage imaging.


Figures

Figure 1.
Figure 1.
Schematic representation of FlicR indicator and directed evolution process. A, B, Representation of FlicR indicator. B, Model of FlicR1 represented by the crystal structures of CiVSD (PDB ID 4G80; Li et al., 2014) and cpmApple (PDB ID 4I2Y; Akerboom et al., 2013). C, Schematic representation of directed evolution strategy used to develop FlicR1. First, libraries of DNA-encoding indicator genes were transformed into E. coli and cultured on agar plates. Second, E. coli colonies expressing FlicR1 were illuminated with yellow light. Colonies with bright red fluorescence were picked and screened for voltage sensitivity in mammalian cells. Voltage sensitivity of FlicR1 variants was then tested via field stimulation in HeLa cells coexpressing ArcLight. D, E, Image of HeLa cells coexpressing ArcLight Q239 (D) and FlicR1 (E), Scale bar,10 μm. F, ArcLight fluorescence response of two regions shown in D to electrical field stimulation pulses (10 ms, 25 V). G, FlicR1 fluorescence response of the same two regions shown in D to electrical field stimulation pulses (10 ms, 25 V). H, Improvement in voltage sensitivity of FlicR variants during directed evolution represented as a ratio of response amplitude in HeLa cells compared with ArcLight Q239. Error bars indicate SD (n = 10–15 cells). Fluorescence imaging for field stimulation measurements was performed at 100 Hz. Illumination intensities were 0.2 W/cm2 for FlicR1 and 0.1 W/cm2 for ArcLight Q239.
Figure 2.
Figure 2.
Sequence alignment of FlicR1. Alignment of FlicR1 gene with the CiVSD domain (top) and cpmApple (residues 60–304, R-GECO1 numbering) from R-GECO1 (bottom). The red highlighted residues are the amino acid mutations of FlicR1 compared with the starting template. Residues MYG in the box correspond to the mApple chromophore. Calmodulin (CaM) and the M13 peptide are not shown in the R-GECO1 sequence.
Figure 3.
Figure 3.
Characterization of FlicR1. A, Image of HEK293 cells expressing FlicR1 under the CMV promoter. Scale bar, 10 μm. B, Fluorescence response (top) to a triangle wave in membrane potential (bottom) from −100 mV to +50 mV. Fluorescence trace (acquired at 10 Hz) is filtered using a 15 point moving-average low-pass filter. C, FlicR1 fluorescence response (top) from a representative cell to a square wave in membrane potential (bottom) from −70 mV to +30 mV. D, E, FlicR1 (D) and ArcLight Q239 (E) fluorescence as a function of membrane voltage in a representative HEK293 cell. Fluorescence is the mean of three ramp cycles from −100 mV to +50 mV and back. Fluorescence is plotted starting at −25 mV, depolarizing to +50 mV, hyperpolarizing to −100 mV, and then returning back up to −25 mV as marked by the arrows. Fluorescence showed little hysteresis between increasing and decreasing voltage ramps. F, FlicR1 fluorescence response to a 100 mV step potential in HEK293 cells. Solid line shows fluorescence response at 34°C. Dotted line shows fluorescence response at 22°C. G, ArcLight Q239 fluorescence response to a 100 mV step potential in HEK293 cells 22°C. Note the different time axis compared with F. H, Magnification of the “on” and “off” portions of 22°C fluorescence traces from FlicR (red) and ArcLight (black). I, Normalized bleaching curves for FlicR1, ArcLight, and ASAP1 in HEK239 cells. J, Time constants for photobleaching of FlicR1, ASAP1, and ArcLight Q239 in HEK293 cells using continuous 10 W/cm2 561 nm light illumination for FlicR1 and continuous 10 W/cm2 488 nm light illumination for ASAP1 and ArcLight Q239. Fluorescence was captured every 500 ms. Time constants are based on single exponential fits. Error bars indicate SEM for FlicR1 (n = 5 cells), ASAP1 (n = 5 cells), and ArcLight Q239 (n = 4 cells). K, Spectral characterization of FlicR1 in vitro. Shown are absorbance (solid black line), excitation (dotted red line), and emission (solid red line) of FlicR1. Fluorescence imaging for voltage-sensitivity measurements was performed at 10 Hz. Step responses were recorded at 2 kHz for FlicR1 and 1 kHz for ArcLight Q239. Illumination intensities were 10 W/cm2.
Figure 4.
Figure 4.
Two-photon imaging of FlicR1 in HEK cells. A, Uncorrected fluorescence response of FlicR1 during −100 to +100 mV voltage steps (0.25 Hz square wave, 2 s +100 mV, 2 s −100 mV) when excited at 1120 nm in image-scanning mode (6.5 frames/s). B, Fluorescence intensity as a function of time for a 1000 Hz point scan of FlicR1 fluorescence during a 100 Hz voltage square wave (5 ms +100 mV, 5 ms −100 mV; n = 50 cycles averaged). C, Fluorescence intensity as a function of time for a point scan of ASAP1 excited at 950 nm and FlicR1 excited at 1120 nm. Fluorescence is sampled at 100 Hz, with excitation power (∼1 mW at both wavelengths) tuned to achieve ∼400 counts per bin initially.
Figure 5.
Figure 5.
FlicR1 characterization in neurons. A, Image of cultured hippocampal neuron expressing FlicR1. Scale bar, 30 μm. B, Detection of spontaneous activity waveforms in rat hippocampal neuron culture with FlicR1 indicator. Sample single-trial recordings of spontaneous action potential bursts from three neurons. Red trace is from cell in A. C, Magnification of regions marked in B. D, FlicR1 fluorescence response to 5 Hz stimulated action potential train. E, Mean fluorescence response of FlicR1 (left) and ArcLight Q239 (right). F, FlicR1 (top) and ArcLight (bottom) response to 10, 50, and 100 Hz stimulated action potential trains in neurons. Colored traces are filtered with Savitzky–Golay smoothing (5 points) and are overlaid over the grayscale unfiltered traces. All traces have single exponential correction of bleach. For AC, fluorescence was recorded at 100 Hz frame rate and illumination intensity was 0.2 W/cm2. For DF, fluorescence was acquired at a 1 kHz frame rate and 10 W/cm2 illumination intensity. Colored traces in DF are filtered with Savitzky–Golay smoothing (5 points) for both FlicR1 and ArcLight Q239.
Figure 6.
Figure 6.
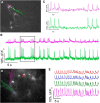
Detection of spontaneous activity and theophylline-induced activity in rat hippocampal brain slice with FlicR1 indicator. A, Fluorescence image of hippocampal brain slice transfected with FlicR1 and imaged 21 d after transfection. Neuron processes are clearly labeled with FlicR1. Both cell bodies and processes show some fluorescence puncta. B, Single-trial fluorescence traces of activity in neuron cell bodies and neuron processes imaged with FlicR1. The traces correspond to the regions in the image marked with the same color. These traces are from wide-field fluorescence data acquired using a 100 W mercury lamp at 100 Hz imaging frequency. C, Magnification of traces in B marked with black borderline. D, Fluorescence image of hippocampal brain slice transfected with FlicR1 and imaged 18 d after transfection. Neuron processes are clearly labeled with FlicR1. Both cell bodies and processes show some fluorescent puncta. E, Fluorescence traces acquired at 50 Hz of theophylline-induced membrane depolarization in neuron cell bodies and neuron processes imaged with FlicR1. The traces correspond to the regions in the image marked with the same color. All fluorescence traces are bleach corrected and traces in B and C are filtered with Savitzky–Golay smoothing (5 pts). Fluorescence traces were recorded at 100 Hz (AC) and 50 Hz (D, E) frame rate. Illumination intensity was 0.4 W/cm2.
Figure 7.
Figure 7.
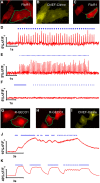
All optical electrophysiology with FlicR1 indicator in mammalian cells and comparison with R-GECO1 photoactivation. A, B, Image of HeLa cells coexpressing FlicR1 (A) and ChIEF-Citrine (B). C, Image of HeLa cells expressing FlicR1 only. D, Fluorescence trace of FlicR1 in HeLa cells activated by 5 Hz stimulation of ChIEF using 405 nm laser pulses. Shown is a trace from the cell in A. E, Fluorescence trace of FlicR1 in HeLa cells activated by 10 Hz stimulation of ChIEF using 405 nm laser pulses. Shown is a trace from the cell in A. F, Control fluorescence trace for FlicR1 in HeLa cells using 405 nm laser pulses without coexpression of ChIEF. Shown is a trace from the cell in C. G, Image of HeLa cells expressing R-GECO1 only. H, I, Image of HeLa cells coexpressing R-GECO1 (H) and ChIEF-Citrine (I). J, Control fluorescence trace for R-GECO1 in HeLa cells using 405 nm laser pulses. Shown is a trace from the cell in G. K, Fluorescence trace of R-GECO1 in HeLa cells activated by stimulation of ChIEF using 405 nm laser pulses. Shown is a trace from the cell in H. Fluorescence traces were recorded at 100 Hz. The intensity of yellow light used to image FlicR1 and R-GECO1 was 60 mW/cm2. 405 nm laser intensity to activate ChIEF was 20 mW/cm2 in all experiments.
Figure 8.
Figure 8.
All-optical electrophysiology using FlicR1 in cultured hippocampal neurons. A, Diagram showing experimental setup using a digital micromirror device (DMD) to target the blue light to the neuronal processes. B, Red, FlicR1 fluorescence readout from single-trial optical recording of single action potentials initiated by pulses of blue light illumination using the experimental setup shown in A. Yellow illumination to image FlicR1 was 10 W/cm2. Black, Patch-clamp recording. Blue, 488 nm illumination (10 ms, 0.5–2 W/cm2). C, Magnification of traces in B marked with black borderline. D, Patch-clamp recording of neuron expressing PsChR when exposed to 561 nm laser (10 W/cm2). This illumination depolarized the cell by 14 mV, but did not induce action potentials on its own. All fluorescence traces are bleach corrected. Fluorescence trace was collected at a frame rate of 500 Hz using an EMCCD camera. Fluorescence trace in C is filtered with Savitzky–Golay smoothing (5 points).

References

    1. Akemann W, Mutoh H, Perron A, Park YK, Iwamoto Y, Knöpfel T. Imaging neural circuit dynamics with a voltage-sensitive fluorescent protein. J Neurophysiol. 2012;108:2323–2337. doi: 10.1152/jn.00452.2012. - DOI - PubMed
    1. Akerboom J, Carreras Calderón N, Tian L, Wabnig S, Prigge M, Tolö J, Gordus A, Orger MB, Severi KE, Macklin JJ, Patel R, Pulver SR, Wardill TJ, Fischer E, Schüler C, Chen TW, Sarkisyan KS, Marvin JS, Bargmann CI, Kim DS, et al. Genetically encoded calcium indicators for multi-color neural activity imaging and combination with optogenetics. Front Mol Neurosci. 2013;6:2. - PMC - PubMed
    1. Alford SC, Wu J, Zhao Y, Campbell RE, Knöpfel T. Optogenetic reporters. Biol Cell. 2013;105:14–29. doi: 10.1111/boc.201200054. - DOI - PubMed
    1. Ataka K, Pieribone VA. A genetically targetable fluorescent probe of channel gating with rapid kinetics. Biophys J. 2002;82:509–516. doi: 10.1016/S0006-3495(02)75415-5. - DOI - PMC - PubMed
    1. Baird GS, Zacharias DA, Tsien RY. Circular permutation and receptor insertion within green fluorescent proteins. Proc Natl Acad Sci U S A. 1999;96:11241–11246. doi: 10.1073/pnas.96.20.11241. - DOI - PMC - PubMed

Publication types