. 2016 Feb 24;36(8):2517-35.
doi: 10.1523/JNEUROSCI.2409-15.2016.

A Distributed Network for Social Cognition Enriched for Oxytocin Receptors

Affiliations

A Distributed Network for Social Cognition Enriched for Oxytocin Receptors

Mariela Mitre et al. J Neurosci. .

Abstract

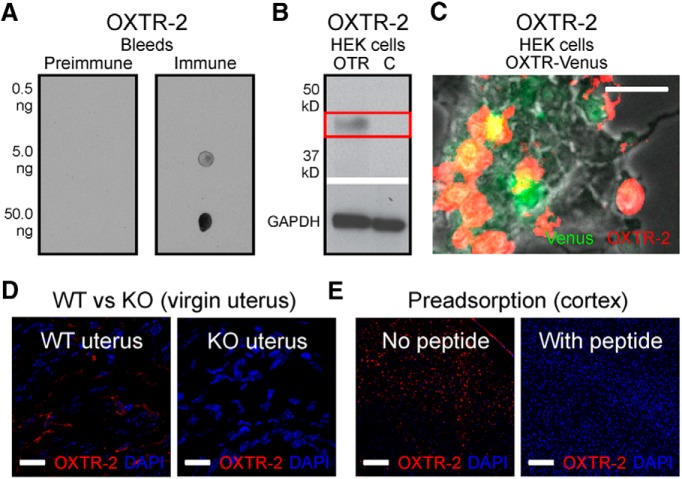
Oxytocin is a neuropeptide important for social behaviors such as maternal care and parent-infant bonding. It is believed that oxytocin receptor signaling in the brain is critical for these behaviors, but it is unknown precisely when and where oxytocin receptors are expressed or which neural circuits are directly sensitive to oxytocin. To overcome this challenge, we generated specific antibodies to the mouse oxytocin receptor and examined receptor expression throughout the brain. We identified a distributed network of female mouse brain regions for maternal behaviors that are especially enriched for oxytocin receptors, including the piriform cortex, the left auditory cortex, and CA2 of the hippocampus. Electron microscopic analysis of the cerebral cortex revealed that oxytocin receptors were mainly expressed at synapses, as well as on axons and glial processes. Functionally, oxytocin transiently reduced synaptic inhibition in multiple brain regions and enabled long-term synaptic plasticity in the auditory cortex. Thus modulation of inhibition may be a general mechanism by which oxytocin can act throughout the brain to regulate parental behaviors and social cognition.

Keywords: antibody; auditory cortex; development; inhibition; oxytocin; synaptic plasticity.


Figures

Figure 1.
Figure 1.
Design of oxytocin receptor antibodies. Aligned sequences of mouse oxytocin receptor and vasopressin V1a/V1b receptors. The four epitope sequences (OXTR-1,2,3,4) chosen for antibody generation are highlighted in bold. *Amino acid identity between oxytocin receptor and either V1a and/or V1b receptor; “:” or “.”, amino acid similarity between oxytocin receptor and either V1a and/or V1b receptor (“:” represents similarity of >0.5 in the Gonnet-PAM 250 matrix).
Figure 2.
Figure 2.
Validation of oxytocin receptor antibody OXTR-2. A, A selective antibody to mouse oxytocin receptor (OXTR-2). Left, Dot blots of preimmune bleeds and three different amounts of OXTR-2 epitope sequence pure peptide. Note lack of immuoreactivity in the preimmune bleeds. Right, immune bleeds show increasing amounts of immunoreactivity detected with larger amounts of pure peptide. B, Immmunoblot of HEK cells expressing mouse oxytocin receptors (OTR) compared with control HEK cells (C). Cells were lysed and immunoblotted with OXTR-2, showing selective detection in transfected receptor-expressing cells but not untransfected control cells. Red boxes, Region around expected molecular weight of the oxytocin receptor (43 kDa). GAPDH, loading controls. C, Immunofluorescence in HEK cells transfected with oxytocin receptor-IRES-Venus construct. Scale, 25 μm. D, OXTR-2 immunostaining in uterus of wild-type (WT uterus) and knock-out animal (KO uterus) imaged at 40×. No staining was detected in tissue from knock-out animals. Scale, 25 μm. E, OXTR-2 immunostaining in cortex of wild-type animals before and after preadsorption with oxytocin receptor peptide imaged at 40×. No staining was detected in tissue from knock-out animals. Scale bar, 100 μm.
Figure 3.
Figure 3.
Expression of oxytocin receptors in virgin female mouse brain. A, Oxytocin receptor immunostaining in PVN with OXTR-2 imaged at 20×. Red, OXTR-2; blue, DAPI. Scale bar, 100 μm. Top, Wild-type (wt). Bottom, Oxytocin receptor knock-out animal (KO). Immunostaining with OXTR-2 did not detect receptors in oxytocin receptor knock-out animals. B, OXTR-2 immunostaining in lateral septum of wild-type (top) and knock-out animal (bottom) imaged at 10×. Scale bar, 150 μm. C, Left auditory cortex of wild-type (top) and knock-out animal (bottom) imaged at 10×. Scale bar, 100 μm. D, Amygdala imaged at 20×. Scale bar, 100 μm. E, Hippocampus imaged at 10×. Scale bar, 500 μm. F, Frontal cortex imaged at 20×. Scale bar, 150 μm. G, Olfactory bulb imaged at 10×. Scale bar, 150 μm. H, Median raphe nucleus imaged at 20×. Scale bar, 150 μm.
Figure 4.
Figure 4.
OXTR-2 expression profile in the brain. A, Schematics summarizing OXTR-2 expression in mothers, virgin females, and males. Shown are four anterior–posterior coronal sections (from left: bregma 2.7 mm, interaural 6.5 mm; bregma 0.7 mm, interaural 4.5 mm; bregma −1.1 mm, interaural 2.7 mm; and bregma −2.3 mm, interaural 1.5 mm). Color indicates percentage of DAPI-positive cells that were OXTR-2+ per region. Brain regions identified and quantified in Table 1: auditory cortex (ACtx), anterior hypothalamus (AHP), basolateral amygdaloid nucleus (BL), central amygdaloid nucleus (Ce), anterior olfactory nucleus (AO), bed nucleus of stria terminalis (BST), hippocampal areas CA1-CA3, dentate gyrus (DG), frontal association cortex (FrA), globus pallidus (LGP), granular cell layer of the olfactory bulb (GrO), lateral hypothalamic area (LH), right lateral septum (LS), motor cortex (M1), nucleus accumbens core (NaC), piriform cortex (PCtx), prelimbic cortex (PrL), paraventricular nucleus of hypothalamus (PVN), median raphe (RN), somatosensory cortex (S1), suprachiasmatic nucleus (SCN), supraoptic nucleus of hypothalamus (SON), visual cortex (V1), and ventromedial hypothalamic nucleus (VMH). Gray areas may have expressed oxytocin receptors but were not quantified here. B, OXTR-2 immunostaining in piriform cortex of female (left) and male (right) imaged at 10×. Note more OXTR-2+ cells in females. Scale bar, 100 μm. C, OXTR-2 immunostaining of virgin female hippocampus imaged at 20×. Scale bar, 200 μm. D, OXTR-2 immunostaining in left auditory cortex (left) and right auditory cortex (right) of virgin female imaged at 20×. Note more staining in left auditory cortex. Scale bar, 100 μm.
Figure 5.
Figure 5.
Oxytocinergic axonal projections from PVN. A, Section of virgin female left auditory cortex from Oxt-IRES-Cre animal expressing YFP via AAV (pAAV-5Ef1a-DIO ChETA-EYFP) stereotaxically injected into left PVN immunostained with antibodies to YFP and imaged at 10×. Green, YFP+ axons; blue, DAPI. Scale bar, 200 μm. B, Section of virgin female barrel cortex imaged at 10×. Scale bar, 200 μm. C, Section of virgin female primary visual cortex imaged at 10×. Scale bar, 200 μm. D, Section of virgin female hippocampus imaged at 10×. White box indicates section shown in E. Scale bar, 200 μm. E, Magnification of CA2 from section shown in D imaged at 20× showing higher number of axon segments in that area. Scale bar, 100 μm. F, Nonsignificant correlation between percentages of OXTR-2+ cells and axon segment densities across 26 brain regions (r = 0.32, p > 0.1). OXTR-2+ cells quantified in four wild-type virgin female mice; YFP+ axon density quantified in seven Oxt-IRES-Cre virgin female mice infected with Cre-inducible pAAV5-Ef1α:-DIO-ChETA-EYFP virus injected into PVN. G, Comparison of axon segment density in six hypothalamic areas (Hypo) versus 20 nonhypothalamic brain areas (Nonhypo). Hypothalamic areas had significantly more YFP+ axon segments (hypothalamus had 933.1 ± 120.9% YFP+ axon segments compared with mean axon length in nonhypothalamic regions, n = 7 virgin female mice, p < 0.001, Student's unpaired two-tailed t test). Statistics and error bars are means ± SEM. **p < 0.01. H, Section of virgin female hypothalamus imaged at 10×. Scale bar, 400 μm. I, Magnification of PVN imaged at 20× showing costaining with antibody to oxytocin peptide (red). Scale bar, 100 μm.
Figure 6.
Figure 6.
Subcellular localization of oxytocin receptors. A, Oxytocin receptor immunoreactivity in the auditory cortex was revealed using HRP-DAB as the immunolabel and antibody dilution of 1:3500. Presynaptic immunolabeling was detected on axospinous asymmetric (presumably excitatory) synapses. The same axon formed another synapse below. At this portion of the axon, the presynaptic side was unlabeled. Scale bar, 500 nm. B, Three other putative excitatory synapses, one synapse with labeling over the PSD and two other unlabeled PSDs shown for comparison. Scale bar, 500 nm. C, Example of labeled inhibitory terminal. Scale bar, 500 nm. D, Cytoplasmic immunolabeling observed in an axon. A labeled PSD is also apparent. Scale bar, 500 nm. E, Cytoplasmic immunolabeling observed in a glial process (putative astrocyte). Scale bar, 500 nm. F, Summary of synaptic location of OXTR-2 in four wild-type (WT, filled bars) and four oxytocin receptor knock-out animals (KO, open bars). Significant labeling was detected at putative excitatory presynaptic terminals (E pre, 6.3 ± 2.2% WT synapses vs 1.4 ± 1.2% KO synapses, p < 10−4, Fisher's two-tailed exact test) and postsynaptic spines (E post, 22.0 ± 3.4% WT synapses vs 3.7 ± 1.7% KO synapses, p < 10−4), putative inhibitory synapses onto dendritic shafts (I pre dend, 11.8 ± 5.2% WT synapses vs 4.4 ± 3.1% KO synapses, p < 0.008; I post dend, 9.3 ± 4.9% WT synapses vs 2.2 ± 2.5% KO synapses, p < 0.0008), and putative inhibitory synapses onto cell bodies (I pre soma, 13.9 ± 8.3% WT synapses vs 2.9 ± 5.4% KO synapses, p < 0.006; I post soma, 15.7 ± 8.3% WT synapses vs 1.9 ± 4.9% KO synapses, p < 0.0005). A total of 637 WT excitatory synapses, 706 KO excitatory synapses, 312 WT inhibitory synapses, and 376 KO inhibitory synapses were examined. Statistics and error bars are means ± 95% binomial confidence intervals. **p < 0.01. G, Summary of cytoplasmic location of OXTR-2 in wild-type and oxytocin receptor knock-out animals. Labeled cytoplasmic segments were quantified relative to the total number of synapses counted (800 WT and 907 KO). Significant labeling was detected in the cytoplasm of putative axon segments (15.0 ± 2.7% WT vs 3.0 ± 1.3% KO, p < 10−4) and glial cells (12.4 ± 2.5% WT vs 7.7 ± 1.9% KO, p < 0.004), but not dendrites (2.5 ± 1.3% WT vs 1.5 ± 1.0% KO, p > 0.1). Statistics and error bars are means ± 95% binomial confidence intervals.
Figure 7.
Figure 7.
Development of auditory thalamocortical oxytocin receptor expression. A, OXTR-2 labeling in female left auditory cortex of postnatal week 1 mouse. Note lower level of expression in layer 4 compared with other layers. Scale bar, 100 μm. B, OXTR-2 labeling in female left auditory cortex of postnatal week 2 mouse. Scale bar, 100 μm. C, OXTR-2 labeling in female left auditory cortex of postnatal week 3 mouse. Scale bar, 100 μm. D, Summary of OXTR-2-labeled cells (top) and OXTR mRNA measured with RNAseq (bottom) at different postnatal weeks (Wk) in auditory thalamus. The first postnatal week had the highest amount of thalamic OXTR-2 expression (n = 18 animals, 4–6 animals/age; p < 10−4, ANOVA with Bonferroni correction for multiple comparisons) and mRNA level (n = 11 animals, 2–3 animals/age; p < 0.05). Filled symbols, tissue from left hemisphere; open symbols, right hemisphere. Red lines and error bars are means ± SEM. E, Summary of OXTR-2-labeled cells (top) and OXTR mRNA (bottom) at different ages in auditory cortex. The second and third postnatal weeks had the highest amount of cortical OXTR-2 expression (n = 21 animals, 4–7 animals/age; p < 10−4) and mRNA level (n = 12 animals, 3 animals/age; p < 0.03). F, Summary of oxytocin receptor lateralization in left versus right virgin female auditory cortex. Top, OXTR-2 expression is higher in left auditory cortex than in right auditory cortex from the same animals during and after postnatal week 3 (n = 11 virgin females, p < 0.0006, Student's paired two-tailed t test), but not earlier during postnatal weeks 1–2 (n = 10 virgin females, p > 0.2). Bottom, oxytocin receptor mRNA (measured with RT-PCR relative to ribophorin mRNA expression) is higher in left auditory cortex than in right auditory cortex from the same adult virgin females (left auditory cortex expressed 112.4 ± 5.4% mRNA as right auditory cortex, n = 9, p < 0.04, Student's paired two-tailed t test). Oxytocin receptor mRNA was not detected in oxytocin receptor knock-out mice (KO, n = 3 virgin females). Statistics and error bars are means ± SEM. *p < 0.05.
Figure 8.
Figure 8.
Laminar expression of OXTR-2 in auditory cortex. Shown is the percentage of OXTR-2-labeled cells in auditory cortex at four different postnatal ages, in superficial layers 1–3, in layer 4, and deep layers 5–6. Layer 4 contains significantly fewer OXTR-2+ cells (**p < 10−4 compared with layers 1–3 and layers 5–6, Fisher's exact two-tailed t test corrected for multiple comparisons), except compared with layers 5–6 in adult animals (#p = 0.09).
Figure 9.
Figure 9.
Exogenous oxytocin reduces synaptic inhibition. A, Whole-cell voltage-clamp recording from layer 5 pyramidal neuron of mouse auditory cortex (ACtx) in vitro. Top, Photomicrograph of experimental setup. Scale bar, 200 μm. Middle, IPSCs evoked with extracellular stimulation. Oxytocin (1 μm) washed into the bath decreased IPSC amplitude (baseline: 262.7 ± 5.1 pA, 3–6 min after start of wash-in: 209.9 ± 7.8 pA, reduced to 79.9% of baseline). Statistics are means ± SEM. Inset, Average IPSC traces at baseline (black) and 3–6 min after wash-in (red). Scale bar, 5 ms, 20 pA. Bottom, Ri and Rs for this experiment, which each changed <10% from baseline during wash-in. B, Whole-cell voltage-clamp recording in piriform cortex (PCtx). Oxytocin (5 μm) decreased IPSCs (baseline: 189.5 ± 4.7 pA, 3–6 min after wash-in: 129.9 ± 4.1 pA, reduced to 68.6% of baseline). Photomicrograph scale bar, 200 μm; inset scale bar, 5 ms, 25 pA. Ri changed <5% and Rs changed ∼20% from baseline during wash-in. C, Whole-cell voltage-clamp recording in PVN. Oxytocin (5 μm) decreased IPSCs (baseline: 159.0 ± 4.6 pA, 3–6 min after wash-in: 110.4 ± 6.1 pA, reduced to 69.4% of baseline). Photomicrograph scale bar, 200 μm; inset scale bar, 15 ms, 50 pA. Ri and Rs each changed <10% from baseline during wash-in. D, Oxytocin (1 μm) rapidly reduced IPSCs in auditory cortex within 3–6 min (decrease to 80.7 ± 3.7% of baseline, n = 7, p < 0.003, Student's paired two-tailed t test; decrease after 5–10 min: 76.4 ± 1.9% of baseline, p < 0.004). E, Oxytocin (5 μm) reduced IPSCs in piriform cortex within 3–6 min (decrease to 74.7 ± 4.5% of baseline, n = 6, p < 0.004; decrease after 5–10 min: 65.0 ± 0.9% of baseline, p < 10−6). F, Oxytocin (5 μm) reduced IPSCs in PVN within 3–6 min (decrease to 71.1 ± 5.3% of baseline, n = 5, p < 0.02; decrease after 5–10 min: 58.5 ± 1.1% of baseline, p < 10−5). G, Dose–response relationship for oxytocin and auditory cortex IPSCs. Oxytocin (1–5 μm) reduced IPSCs by a comparable level (p > 0.7, ANOVA). Light red circles, Individual recordings; red line, sigmoidal fit (goodness-of-fit r2 = 0.72, n = 25). H, Dose–response relationship for oxytocin and piriform cortex IPSCs (goodness-of-fit r2 = 0.88, n = 22). Oxytocin (5 and 10 μm) reduced IPSCs by a comparable level (p > 0.7, Student's unpaired two-tailed t test). I, Dose–response relationship for oxytocin and PVN IPSCs (goodness-of-fit r2 = 0.81, n = 20). Oxytocin (5 and 10 μm) reduced IPSCs by a comparable level (p > 0.9, Student's unpaired two-tailed t test).
Figure 10.
Figure 10.
Endogenous oxytocin reduces synaptic inhibition. A, Whole-cell voltage-clamp recording from layer 5 pyramidal neuron of Oxt-IRES-Cre mouse auditory cortex (ACtx) in vitro. Optogenetic stimulation of oxytocin axons decreased IPSC amplitude (baseline: 115.0 ± 4.0 pA, 3–6 min after start of optogenetic stimulation: 72.0 ± 4.4 pA, reduced to 62.7% of baseline). Statistics are means ± SEM. Inset, Average IPSC traces at baseline (black) and 3–6 min after start of optogenetic stimulation (blue). Scale bar, 15 ms, 50 pA. B, Whole-cell voltage-clamp recording in piriform cortex (PCtx). Optogenetic stimulation decreased IPSCs (baseline: 72.4 ± 2.8 pA, 3–6 min after optogenetic stimulation: 48.9 ± 2.1 pA, reduced to 67.6% of baseline). Scale bar, 30 ms, 50 pA. C, Whole-cell voltage-clamp recording in PVN. Optogenetic stimulation decreased IPSCs (baseline: 232.8 ± 9.1 pA, 3–6 min after optogenetic stimulation: 123.1 ± 9.3 pA, reduced to 52.9% of baseline). Scale bar, 30 ms, 100 pA. D, Optogenetic stimulation rapidly reduced IPSCs in auditory cortex within 3–6 min (decrease to 72.8 ± 1.8% of baseline, n = 6, p < 0.002, Student's paired two-tailed t test; decrease after 5–10 min: 56.5 ± 9.0% of baseline, p < 0.002). E, Optogenetic stimulation reduced IPSCs in piriform cortex (decrease to 64.8 ± 4.1% of baseline, n = 5, p < 0.02; decrease after 5–10 min: 60.9 ± 4.2% of baseline, p < 0.02). F, Optogenetic stimulation reduced IPSCs in PVN (decrease to 71.9 ± 7.6% of baseline, n = 4, p < 0.04; decrease after 5–10 min: 67.7 ± 6.7% of baseline, p < 0.02).
Figure 11.
Figure 11.
Oxytocin modulation of evoked and spontaneous activity in auditory cortex. A, Oxytocin reduced evoked IPSCs within 3–6 min (auditory cortex 1 μm oxytocin, decrease to 80.7 ± 3.7% of baseline, n = 7, p < 0.003, Student's paired two-tailed t test; auditory cortex optogenetics, decrease to 72.8 ± 1.8% of baseline, n = 6, p < 0.002; piriform cortex 5 μm oxytocin, decrease to 74.7 ± 4.5% of baseline, n = 6, p < 0.004; piriform cortex optogenetics, decrease to 64.8 ± 4.1% of baseline, n = 5, p < 0.02; PVN 5 μm oxytocin, decrease to 71.1 ± 5.3% of baseline, n = 5, p < 0.02; PVN optogenetics, decrease to 71.9 ± 7.6% of baseline, n = 4, p < 0.04). *p < 0.05; **p < 0.01. B, Oxytocin did not significantly affect evoked EPSCs in the first 3–6 min (auditory cortex 1 μm oxytocin, 98.2 ± 4.4% of baseline, p > 0.7, Student's paired two-tailed t test; auditory cortex optogenetics, 90.5 ± 10.9% of baseline, p > 0.4; piriform cortex 5 μm oxytocin, 97.0 ± 4.4% of baseline, p > 0.5; piriform cortex optogenetics, 103.5 ± 16.8% of baseline, p > 0.8; PVN 5 μm oxytocin, 104.5 ± 13.6% of baseline, p > 0.7; PVN optogenetics, 80.4 ± 10.7% of baseline, p > 0.1). C, OTA (1 μm) prevented oxytocinergic reduction of IPSCs (auditory cortex 1 μm oxytocin, 107.4 ± 5.9% of baseline, n = 4, p > 0.3; piriform cortex 5 μm oxytocin, 98.1 ± 4.8% of baseline, n = 4, p > 0.7; PVN 5 μm oxytocin, 100.1 ± 6.3% of baseline, n = 3, p > 0.9). D, Oxytocin reduced IPSCs in DNQX/APV (25 and 50 μm) in auditory cortex and PVN but not piriform cortex (auditory cortex 1 μm oxytocin, decrease to 73.1 ± 5.3% of baseline, n = 8, p < 0.002; piriform cortex 5 μm oxytocin, 94.2 ± 2.8% of baseline, n = 5, p > 0.1; PVN 5 μm oxytocin, decrease to 86.9 ± 2.2% of baseline, n = 5, p < 0.005). E, Example periods of spontaneous activity before (black) and during oxytocin wash-in (red). Left, EPSCs and IPSCs from virgin female left auditory cortex. Scale bar, 100 ms, 10 pA. Middle, Piriform cortex. Scale bar, 25 ms, 10 pA. Right, PVN. Scale bar, 100 ms, 10 pA. *Detected events in each trace. F, Oxytocin increased spontaneous event frequency (auditory cortex 1 μm oxytocin, spontaneous EPSC frequency increased to 133.1 ± 10.3% of baseline, p < 0.04; auditory cortex spontaneous IPSC frequency increased to 169.5 ± 17.6% of baseline, p < 0.03; piriform cortex 5 μm oxytocin, spontaneous EPSC frequency increased to 151.3 ± 19.1% of baseline, p < 0.05; piriform cortex spontaneous IPSC frequency increased to 422.1 ± 92.0% of baseline, p < 0.04; PVN 5 μm oxytocin, spontaneous EPSC frequency increased to 124.8 ± 2.8% of baseline, p < 0.004; PVN spontaneous IPSC frequency increased to 145.9 ± 13.3% of baseline, p < 0.05). Filled bars, EPSCs; open bars, IPSCs. G, Oxytocin did not significantly affect spontaneous event amplitude (auditory cortex 1 μm oxytocin, spontaneous EPSC amplitude was 96.4 ± 2.3% of baseline, p > 0.1; auditory cortex spontaneous IPSC amplitude was 107.7 ± 8.2% of baseline, p > 0.4; piriform cortex 5 μm oxytocin, spontaneous EPSC amplitude was 93.2 ± 3.3% of baseline, p > 0.05; piriform cortex spontaneous IPSC amplitude was 102.5 ± 6.8% of baseline, p > 0.7; PVN 5 μm oxytocin, spontaneous EPSC amplitude was 95.9 ± 3.0% of baseline, p > 0.2; PVN spontaneous IPSC amplitude was 111.8 ± 8.9% of baseline, p > 0.2).
Figure 12.
Figure 12.
Oxytocin enables cortical plasticity in vitro. A, Current-clamp recording from layer 5 pyramidal cell of virgin female auditory cortex in vitro. Oxytocin (OT, 5 μm, red bar) washed into the bath gradually increased EPSP slope (baseline: 6.9 ± 0.1 mV/msec, 10–20 min after start of wash-in: 8.3 ± 0.1 mV/msec, increased to 120.6% of baseline) and spiking probability (upper raster plot, baseline: 4.0% of trials, 10–20 min after wash-in: 96.3% of trials; cell was depolarized by 19 mV). Inset, Representative traces before (gray) and ∼15 min after (red) oxytocin wash-in. Scale bar, 10 ms, 10 mV. Ri of this neuron was stable (mean Ri before wash-in: 165.5 MΩ, mean Ri 10–20 min after wash-in: 166.8 MΩ). B, Current-clamp recording from auditory cortex of virgin female Oxt-IRES-Cre animal. Optogenetic release of oxytocin (Opto, blue bar) increased EPSP slope (baseline: 2.5 ± 0.1 mV/msec, 10–20 min after start of optogenetic stimulation: 3.5 ± 0.05 mV/msec, increased to 141.6% of baseline) and spiking probability (upper raster plot, baseline: 18.2% of trials, 10–20 min after start of optogenetic stimulation: 48.7% of trials; cell was depolarized by 19 mV). Inset, Representative traces before (gray) and ∼15 min after (blue) optogenetic stimulation. Scale bar, 10 ms, 10 mV. Ri of this neuron was stable (mean Ri before: 92.4 MΩ, mean Ri 10–20 min after: 88.9 MΩ). C, Current-clamp recording from layer 5 pyramidal cell of virgin female auditory cortex in vitro. Oxytocin wash-in (5 μm oxytocin, red bar) in the presence of APV (50 μm APV, black bar) did not enhance EPSP slope (baseline: 6.6 ± 0.1 mV/msec, 10–20 min after wash-in: 5.5 ± 0.1 mV/msec, decreased to 83.1% of baseline) or spiking probability (upper raster plot, baseline: 20.8% of trials, 10–20 min after wash-in: 10.0% of trials; cell was depolarized by 12 mV). Inset, Representative traces before (gray) and ∼15 min after oxytocin wash-in in APV (red). Scale bar, 20 ms, 5 mV. Ri of this neuron was stable (mean Ri before wash-in: 112.6 MΩ, mean Ri 10–20 min after wash-in: 112.1 MΩ). D, Current-clamp recording from layer 5 pyramidal cell of virgin female auditory cortex in vitro. Gabazine (0.1 μm, black bar) washed into the bath gradually increased EPSP slope (baseline: 4.8 ± 0.1 mV/msec, 10–20 min after start of wash-in: 6.8 ± 0.1 mV/msec, increased to 145.5% of baseline) and spiking probability (upper raster plot, baseline: 6.3% of trials, 10–20 min after wash-in: 100.0% of trials; cell was depolarized by 12 mV). Inset, Representative traces before (gray) and ∼15 min after gabazine wash-in (black). Scale bar, 10 ms, 25 mV. Bottom, Ri of this neuron was stable (mean Ri before wash-in: 122.1 MΩ, mean Ri 10–20 min after wash-in: 108.9 MΩ). E, Oxytocin or gabazine enabled long-term plasticity of synaptic responses in vitro. Mean change in EPSP slope after oxytocin wash-in (5 μm, mean increase to 117.7 ± 7.2% of baseline, n = 10, p < 0.04; Student's paired two-tailed t test), optogenetic release of oxytocin (mean increase to 119.3 ± 5.4% of baseline, n = 5, p < 0.03), oxytocin in APV (5 μm oxytocin, 50 μm APV, 97.2 ± 10.2% of baseline, n = 6, p > 0.7), or gabazine wash-in (0.1 μm, mean increase to 117.2 ± 6.6% of baseline, n = 7, p < 0.05). *p < 0.05. F, Oxytocin or gabazine enabled long-term enhancement of spike firing in auditory cortex. Mean trial-by-trial spiking probabilities before and 10–20 min after oxytocin wash-in (Bef., spike probability per trial before oxytocin: 16.3 ± 3.2%; Aft., spiking probability after oxytocin: 38.8 ± 8.6%, n = 10, p < 0.05) before and 10–20 min after optogenetic release of oxytocin (spike probability per trial before optogenetic stimulation: 21.8 ± 5.7%, spiking probability after optogenetic stimulation: 66.6 ± 12.7%, n = 5, p < 0.03), before and 10–20 min after oxytocin in APV (spiking probability before oxytocin in APV: 15.5 ± 2.0%, spiking probability after oxytocin in APV: 14.7 ± 7.8%, n = 6, p > 0.9), or before and 10–20 min after gabazine wash-in (spike probability per trial before gabazine: 12.2 ± 3.4%, spiking probability after gabazine: 85.4 ± 8.5%, n = 7, p < 0.0002). Same recordings as in E. *p < 0.05; **p < 0.01. Statistics and error bars are means ± SEM.
Figure 13.
Figure 13.
Oxytocin enables cortical plasticity in vivo. A, Whole-cell current-clamp recordings in virgin female mice of synaptic responses to pure tones before and after oxytocin pairing. Left, Averaged tone-evoked responses from an example whole-cell recording of AI frequency tuning in vivo. After measuring baseline frequency tuning, topical application of oxytocin was paired with 14 kHz tones (arrow) and tuning curves measured 11–20 min afterward (gray dashed line, baseline responses to 14 kHz tones: 0.8 ± 0.2 mV; black solid line, 11–20 min after pairing: 1.7 ± 0.3 mV; increase of 214.4% from baseline, p < 0.03, Student's unpaired two-tailed t test). Inset, Example EPSPs evoked by paired 14 kHz tones before (gray) and 11–20 min after (black) pairing. Scale bar, 1 mV, 50 ms. Right, Summary of EPSPs measured in current-clamp mode. Tone-evoked synaptic responses at the paired frequency were increased after pairing (mean increase 11–20 min after pairing to 167.7 ± 20.0% of baseline, n = 4 neurons, p < 0.05, Student's paired two-tailed t test). B, Single-unit (cell-attached) recordings of spiking in virgin female left auditory cortex before and after oxytocin pairing. Left, Average tone-evoked responses from cell-attached recording of frequency tuning before and 11–20 min after oxytocin pairing with 39 kHz tones (gray dashed line, baseline responses to 39 kHz tones: 0.25 ± 0.08 spikes/tone, 11–20 min after pairing: 0.75 ± 0.19 spikes/tone, p < 0.03, Student's unpaired two-tailed t test). Right, Summary of single-unit recordings before and after pairing (before pairing: 0.05 ± 0.03 spikes/tone, 11–20 min after pairing: 0.76 ± 0.23 spikes/tone, n = 10 neurons, p < 0.02, Student's paired two-tailed t test). C, Extracellular recordings of multiunit activity in vivo before and after oxytocin pairing. Left, Average tone-evoked responses from multiunit recording before and 11–20 min after pairing oxytocin with 16 kHz tones (gray dashed line, baseline responses to 16 kHz tones: 0.0 ± 0.0 spikes/tone; black solid line, 11–20 min after pairing: 0.44 ± 0.03 spikes/tone; p < 10−4, Student's unpaired two-tailed t test). Right, Summary of multiunit recordings before and after pairing (before pairing: 0.50 ± 0.39 spikes/tone, 11–20 min after pairing: 2.06 ± 0.63 spikes/tone, n = 7 recordings, p < 0.04, Student's paired two-tailed t test).

References

    1. Anders S, Pyl PT, Huber W. HTSeq-a Python framework to work with high-throughput sequencing data. Bioinformatics. 2015;31:166–169. doi: 10.1093/bioinformatics/btu638. - DOI - PMC - PubMed
    1. Barkat TR, Polley DB, Hensch TK. A critical period for auditory thalamocortical connectivity. Nat Neurosci. 2011;14:1189–1194. doi: 10.1038/nn.2882. - DOI - PMC - PubMed
    1. Bartz JA, Zaki J, Bolger N, Ochsner KN. Social effects of oxytocin in humans: context and person matter. Trends Cogn Sci. 2011;15:301–309. - PubMed
    1. Biddle FG, Eales BA. The degree of lateralization of paw usage (handedness) in the mouse is defined by three major phenotypes. Behav Genet. 1996;26:391–406. doi: 10.1007/BF02359483. - DOI - PubMed
    1. Byers SL, Wiles MV, Dunn SL, Taft RA. Mouse estrous cycle identification tool and images. PLoS One. 2012;7:e35538. doi: 10.1371/journal.pone.0035538. - DOI - PMC - PubMed

Publication types

LinkOut - more resources