

Quantitative comparison of PET performance-Siemens Biograph mCT and mMR
- PMID: 26911722
- PMCID: PMC4766138
- DOI: 10.1186/s40658-016-0142-7
Quantitative comparison of PET performance-Siemens Biograph mCT and mMR
Abstract
Background: Integrated clinical whole-body PET/MR systems were introduced in 2010. In order to bring this technology into clinical usage, it is of great importance to compare the performance with the well-established PET/CT. The aim of this study was to evaluate PET performance, with focus on image quality, on Siemens Biograph mMR (PET/MR) and Siemens Biograph mCT (PET/CT).
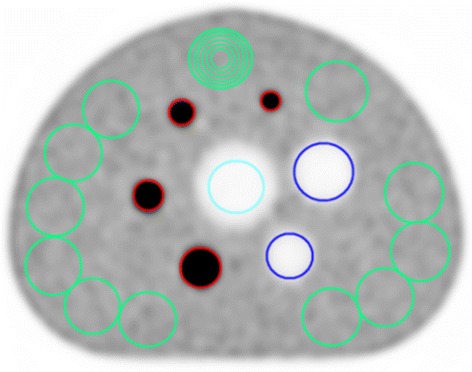
Methods: A direct quantitative comparison of the performance characteristics between the mMR and mCT system was performed according to National Electrical Manufacturers Association (NEMA) NU 2-2007 protocol. Spatial resolution, sensitivity, count rate and image quality were evaluated. The evaluation was supplemented with additional standardized uptake value (SUV) measurements.
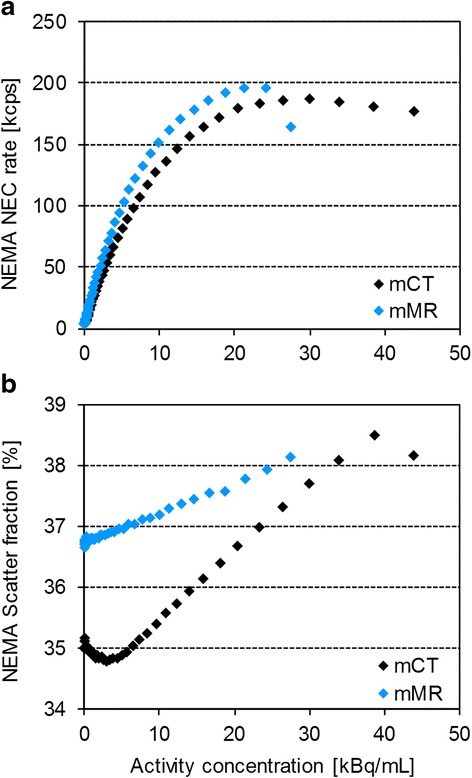
Results: The spatial resolution was similar for the two systems. Average sensitivity was higher for the mMR (13.3 kcps/MBq) compared to the mCT system (10.0 kcps/MBq). Peak noise equivalent count rate (NECR) was slightly higher for the mMR (196 kcps @ 24.4 kBq/mL) compared to the mCT (186 kcps @ 30.1 kBq/mL). Scatter fractions in the clinical activity concentration range yielded lower values for the mCT (34.9 %) compared to those for the mMR (37.0 %). Best image quality of the systems resulted in approximately the same mean hot sphere contrast and a difference of 19 percentage points (pp) in mean cold contrast, in favour of the mCT. In general, point spread function (PSF) increased hot contrast and time of flight (TOF) increased both hot and cold contrast. Highest hot contrast for the smallest sphere (10 mm) was achieved with the combination of TOF and PSF on the mCT. Lung residual error was higher for the mMR (22 %) than that for the mCT (17 %), with no effect of PSF. With TOF, lung residual error was reduced to 8 % (mCT). SUV was accurate for both systems, but PSF caused overestimations for the 13-, 17- and 22-mm spheres.
Conclusions: Both systems proved good performance characteristics, and the PET image quality of the mMR was close to that of the mCT. Differences between the systems were mainly due to the TOF possibility on the mCT, which resulted in an overall better image quality, especially for the most challenging settings with higher background activity and small uptake volumes.
Keywords: PET performance; PET/CT; PET/MR; Quantitative image quality.
Figures


References
LinkOut - more resources
Full Text Sources
Other Literature Sources
Research Materials
Miscellaneous
