

Meat, the metabolites: an integrated metabolite profiling and lipidomics approach for the detection of the adulteration of beef with pork
- PMID: 26911805
- PMCID: PMC4819684
- DOI: 10.1039/c6an00108d
Meat, the metabolites: an integrated metabolite profiling and lipidomics approach for the detection of the adulteration of beef with pork
Abstract
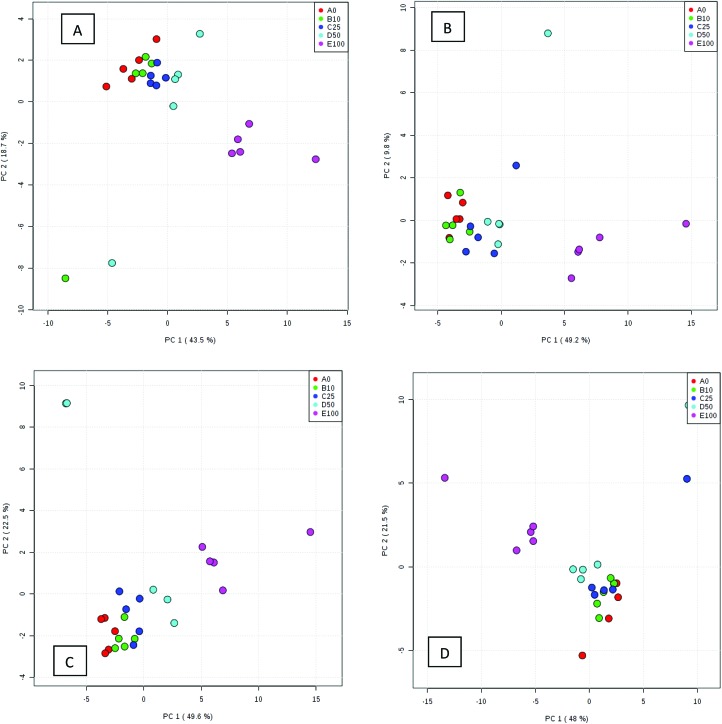
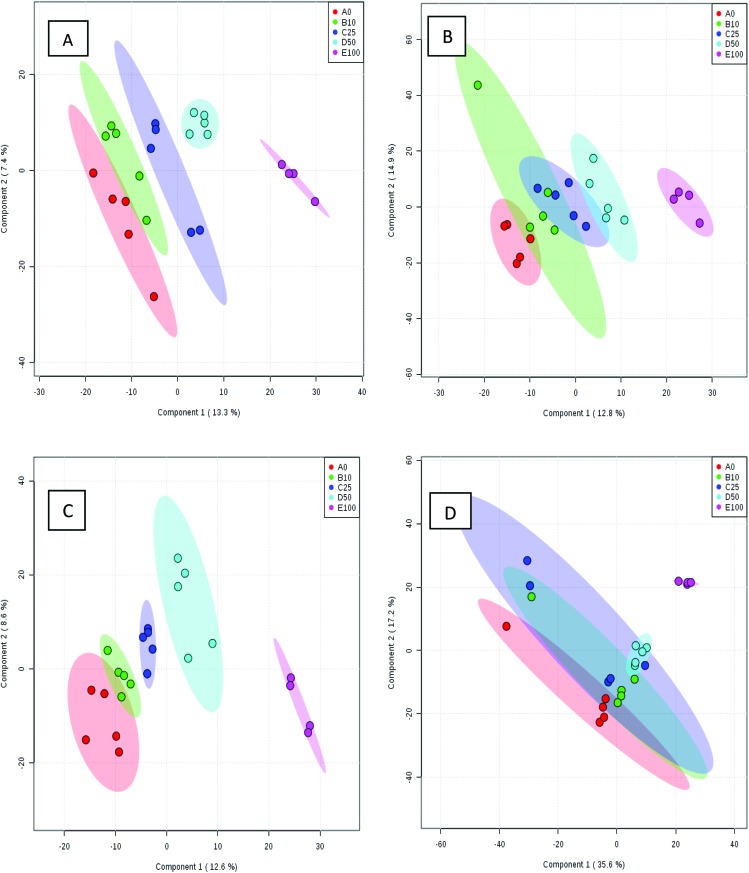
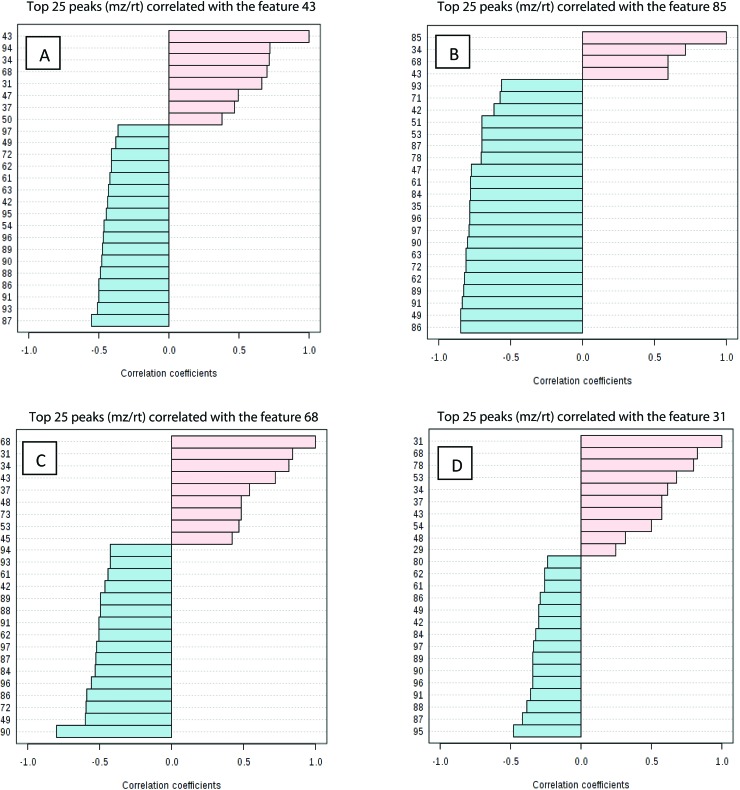
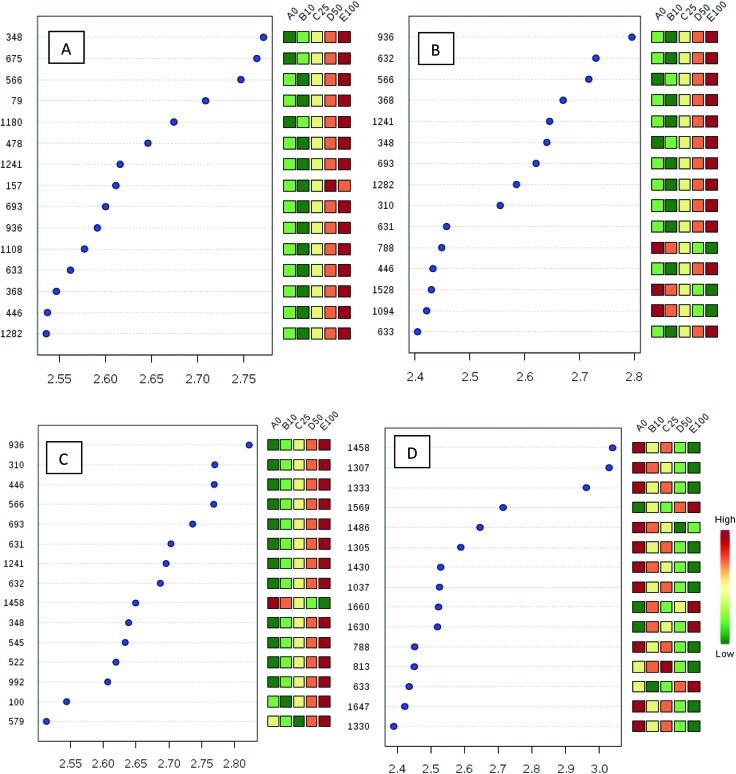
Adulteration of high quality food products with sub-standard and cheaper grades is a world-wide problem taxing the global economy. Currently, many traditional tests suffer from poor specificity, highly complex outputs and a lack of high-throughput processing. Metabolomics has been successfully used as an accurate discriminatory technique in a number of applications including microbiology, cancer research and environmental studies and certain types of food fraud. In this study, we have developed metabolomics as a technique to assess the adulteration of meat as an improvement on current methods. Different grades of beef mince and pork mince, purchased from a national retail outlet were combined in a number of percentage ratios and analysed using GC-MS and UHPLC-MS. These techniques were chosen because GC-MS enables investigations of metabolites involved in primary metabolism whilst UHPLC-MS using reversed phase chromatography provides information on lipophilic species. With the application of chemometrics and statistical analyses, a panel of differential metabolites were found for identification of each of the two meat types. Additionally, correlation was observed between metabolite content and percentage of fat declared on meat products' labelling.
Figures
References
-
- Moore J. C., Spink J., Lipp M. J. Food Sci. 2012;77:R118–R126. - PubMed
-
- Ellis D. I., Muhamadali H., Haughey S. A., Elliott C. T., Goodacre R. Anal. Methods. 2015;7:9401–9414.
-
- Ellis D. I., Brewster V. L., Dunn W. B., Allwood J. W., Golovanov A. P., Goodacre R. Chem. Soc. Rev. 2012;41:5706–5727. - PubMed
-
- Editorial, The Lancet, 2009. 373 9661, 353.
-
- Elliott C., Elliott review into the integrity and assurance of food supply networks – final report, A national food crime prevention framework, 2014.
Publication types
MeSH terms
Grants and funding
LinkOut - more resources
Full Text Sources
Other Literature Sources
Miscellaneous