

doi: 10.1038/ncomms10763.
Calcium imaging of sleep-wake related neuronal activity in the dorsal pons
Affiliations
- PMID: 26911837
- PMCID: PMC4773416
- DOI: 10.1038/ncomms10763
Item in Clipboard
Calcium imaging of sleep-wake related neuronal activity in the dorsal pons
Nat Commun.
.
Abstract
The dorsal pons has long been implicated in the generation of rapid eye movement (REM) sleep, but the underlying circuit mechanisms remain poorly understood. Using cell-type-specific microendoscopic Ca(2+) imaging in and near the laterodorsal tegmental nucleus, we found that many glutamatergic neurons are maximally active during REM sleep (REM-max), while the majority of GABAergic neurons are maximally active during wakefulness (wake-max). Furthermore, the activity of glutamatergic neurons exhibits a medio-lateral spatial gradient, with medially located neurons more selectively active during REM sleep.
Figures
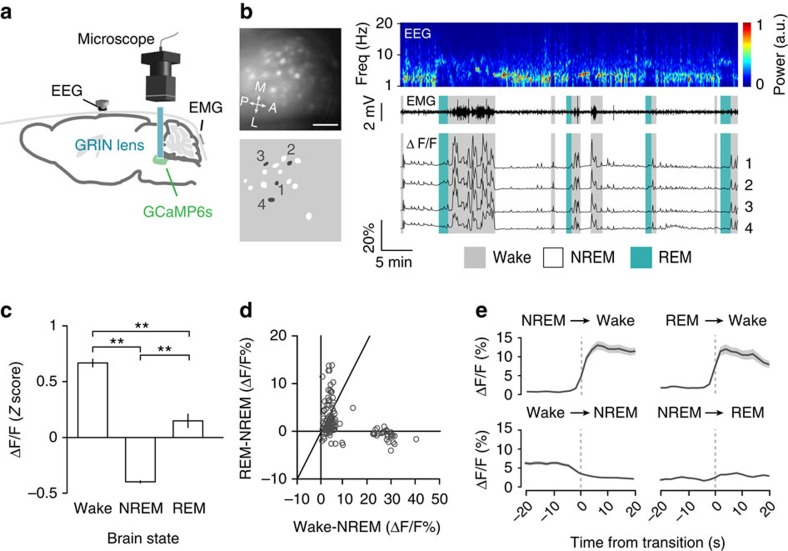
(a) Schematic of microendoscopic Ca2+ imaging and brain state recording. (b) An example imaging session from a GAD2-IRES-Cre mouse. Left panels: imaging field (upper) and identified ROIs corresponding to neuronal somas (lower). Grey masks and numbers indicate ROIs whose ΔF/F traces are plotted on the right. Scale bar, 100 μm. Right panels: EEG power spectrogram, EMG trace and ΔF/F traces. Brain states are indicated by coloured shading. Grey, wake; white, NREM; blue, REM (c) Z-scored ΔF/F activity during wakefulness, NREM and REM sleep averaged across all GABAergic neurons imaged in six mice (n=130). F2,129=160.7, P=4.7 × 10−46, one-way repeated measures ANOVA; **P<0.01, two-tailed Tukey's post hoc comparison. (d) Difference between REM and NREM activity versus difference between wake and NREM activity. Each symbol represents one neuron (n=130). Diagonal line: equal activity between wake and REM states. The majority of GABAergic neurons were more active during wake than REM states (below diagonal). (e) ΔF/F activity at brain state transitions, averaged across all GABAergic neurons. Grey shading, ±s.e.m.
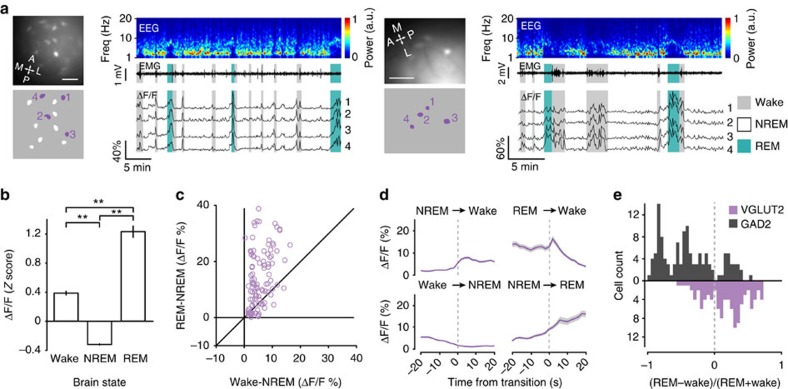
(a) Example imaging sessions from two VGLUT2-IRES-Cre mice. Shown in each example are imaging field, identified ROIs, EEG power spectrogram, EMG trace and ΔF/F traces of example ROIs across brain states (coloured shading). Grey, wake; white: NREM; blue: REM. Scale bars, 100 μm. (b) Z-scored ΔF/F activity during wakefulness, NREM sleep and REM sleep averaged across all glutamatergic neurons imaged in seven mice (n=104). F2,103=234.6, P=8.0 × 10−54, one-way repeated measures ANOVA; **P<0.01, two-tailed Tukey's post hoc comparisons. (c) Difference between REM and NREM activity versus difference between wake and NREM activity. Each symbol represents one neuron (n=104). Diagonal line: equal activity between wake and REM states. Most of the glutamatergic neurons were above the diagonal. (d) ΔF/F activity at brain state transitions averaged across all glutamatergic neurons. Grey shading, ±s.e.m. (e) Distributions of relative REM versus wake activity of GABAergic and glutamatergic neurons (>0, more active during REM than wakefulness).
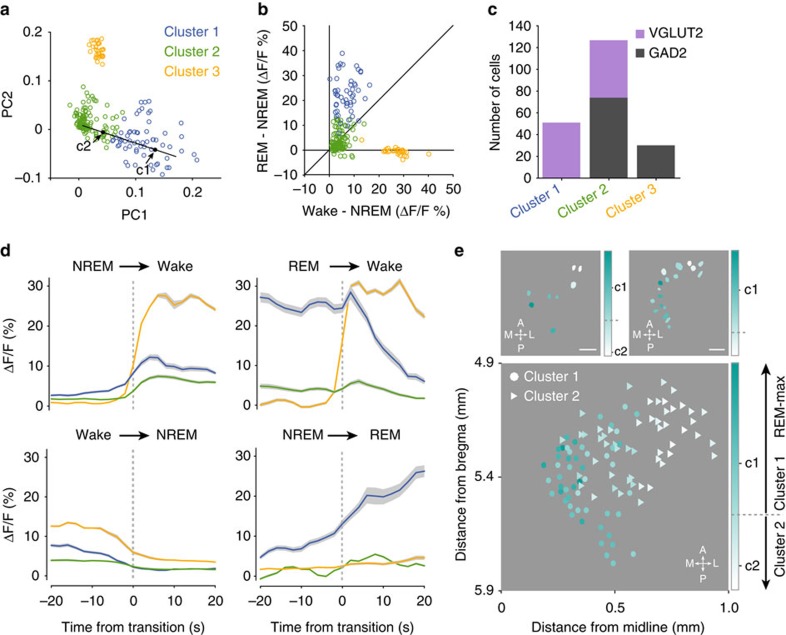
(a) Scatter plot of both glutamatergic and GABAergic neurons in the space spanned by the first two principal components (PC1 versus PC2) of ΔF/F activity at brain state transitions (n=220). The cluster identity determined with k-means clustering is indicated by colour. The centroids of Clusters 1 and 2 are marked as c1 and c2. (b) REM–NREM versus wake–NREM activity of all glutamatergic and GABAergic neurons in the three clusters (cluster identity is colour-coded). Note that neurons in Clusters 1 and 3 are REM- and wake-max, respectively. Neurons in Cluster 2 showed weaker brain-state modulation than those in Clusters 1 and 3, but their average activity is wake-max. (c) The cell-type composition of each cluster. (d) ΔF/F activity at brain state transitions averaged across neurons within each cluster (cluster identity is colour-coded). Grey shading, ±s.e.m. (e) Spatial distribution of sleep-wake activity of glutamatergic neurons. Brain-state-dependent activity of each neuron is quantified by the relative distances from the centroids of Cluster 1 (c1 in a, REM-max) and Cluster 2 (c2, wake-max), coded by colour. Top panels: spatial organization of neuronal functional properties in two example VGLUT2-IRES-Cre mice. Scale bars, 100 μm. Lower panel: spatial organization of all glutamatergic neurons imaged in seven mice. Different symbols indicate cluster identity.
References
-
- Aserinsky E. & Kleitman N. Regularly occurring periods of eye motility, and concomitant phenomena, during sleep. Science 118, 273–274 (1953). - PubMed
-
- Dement W. The occurrence of low voltage, fast, electroencephalogram patterns during behavioral sleep in the cat. Electroencephalogr. Clin. Neurophysiol. 10, 291–296 (1958). - PubMed
-
- Jouvet M. Research on the neural structures and responsible mechanisms in different phases of physiological sleep. Arch. Ital. Biol. 100, 125–206 (1962). - PubMed
-
- McCarley R. W. Chapter 10 - neurobiology of REM sleep. Handb. Clin. Neurol. 38, 151–171 (2011). - PubMed
Publication types
MeSH terms
Substances
Grants and funding
LinkOut - more resources
Full Text Sources
Other Literature Sources
Molecular Biology Databases
Miscellaneous
