. 2016 Feb 25:6:22017.
doi: 10.1038/srep22017.

Wide-field optical coherence tomography based microangiography for retinal imaging

Affiliations

Wide-field optical coherence tomography based microangiography for retinal imaging

Qinqin Zhang et al. Sci Rep. .

Abstract

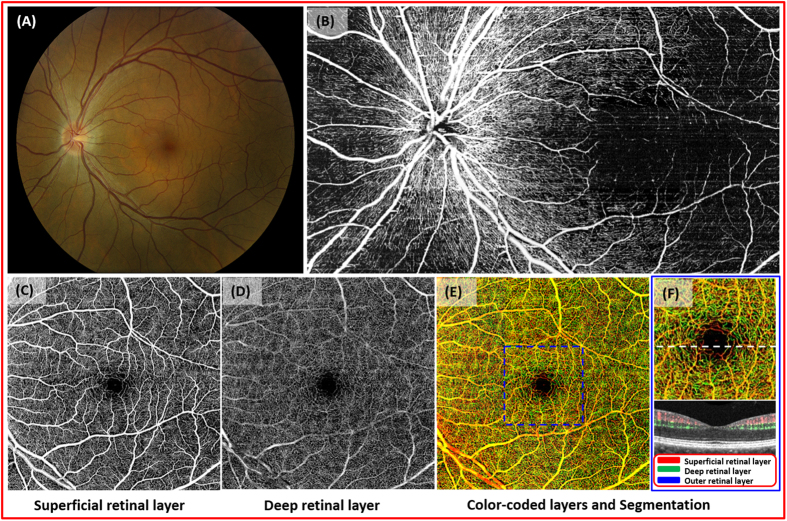
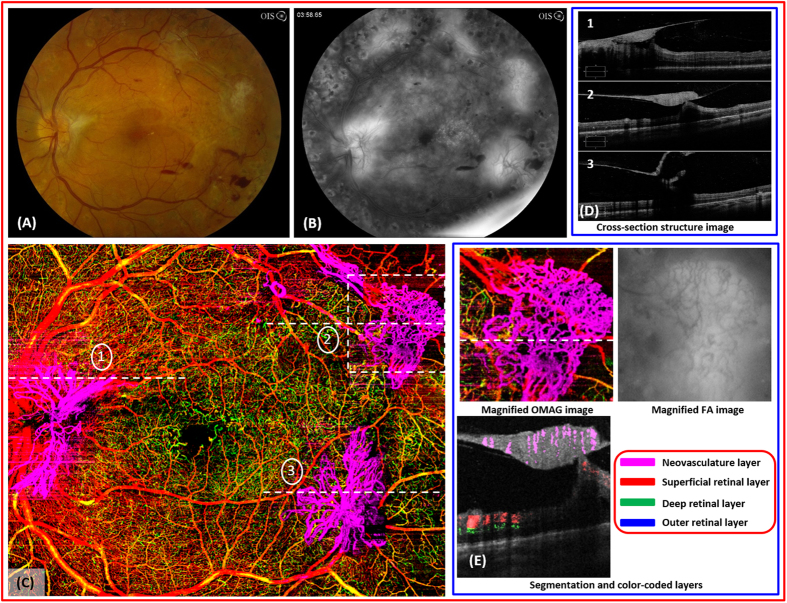
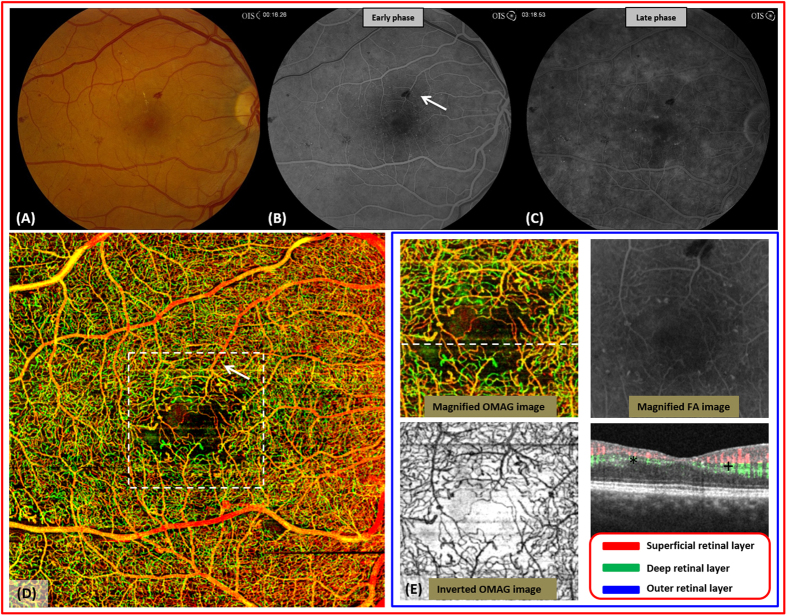
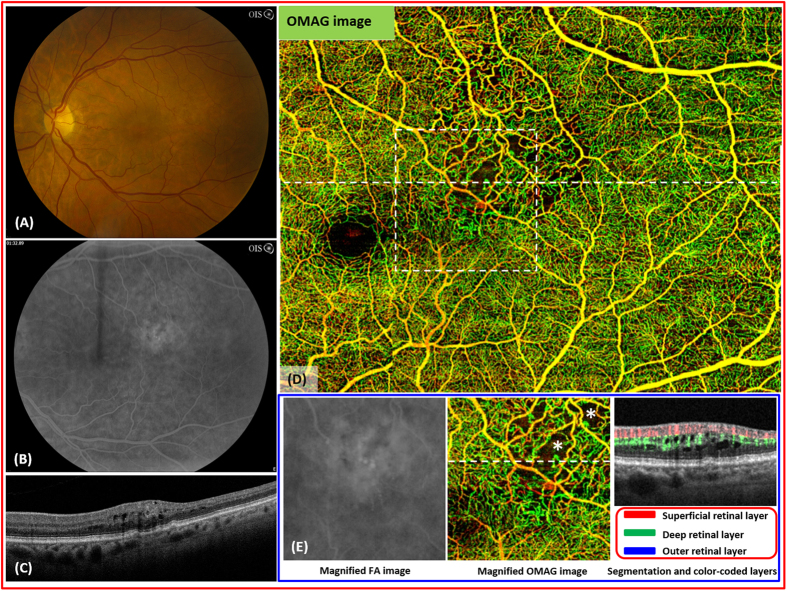
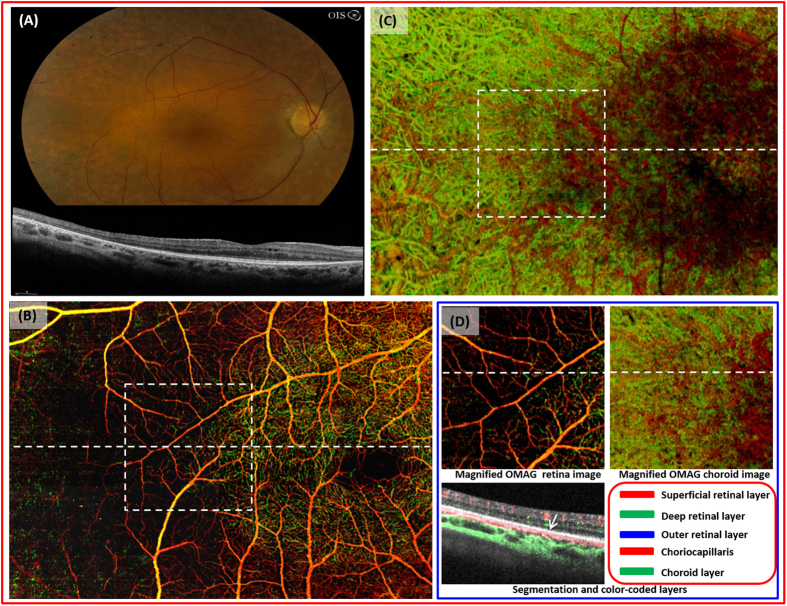
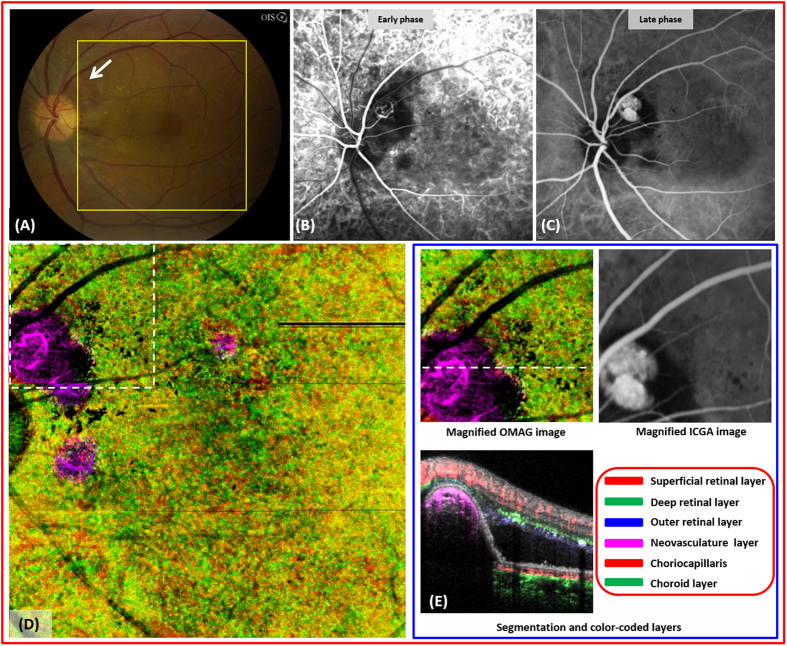
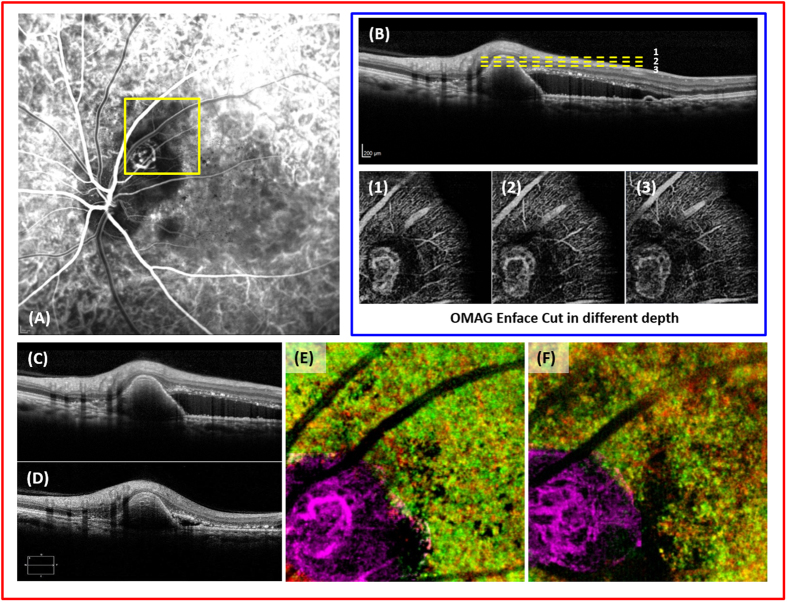
Optical coherence tomography angiography (OCTA) allows for the evaluation of functional retinal vascular networks without a need for contrast dyes. For sophisticated monitoring and diagnosis of retinal diseases, OCTA capable of providing wide-field and high definition images of retinal vasculature in a single image is desirable. We report OCTA with motion tracking through an auxiliary real-time line scan ophthalmoscope that is clinically feasible to image functional retinal vasculature in patients, with a coverage of more than 60 degrees of retina while still maintaining high definition and resolution. We demonstrate six illustrative cases with unprecedented details of vascular involvement in retinal diseases. In each case, OCTA yields images of the normal and diseased microvasculature at all levels of the retina, with higher resolution than observed with fluorescein angiography. Wide-field OCTA technology will be an important next step in augmenting the utility of OCT technology in clinical practice.


Conflict of interest statement

RKW received research support from Carl Zeiss Meditec, Inc. TZ, US were employed by Carl Zeiss Meditec, Inc. RKW and the Oregon Health & Science University co-own a patent that is related to the subject matter discussed in this manuscript. RKW received an innovative research award from Research to Prevent Blindness. MJ is a consultant for Healonics, Sensimed, Ivantis, Cascade Ophthalmics, and receives royalties from intellectual property owned by Allergan. QQ, CL, JC, CC, AZ, JL, KR, KP, RM, JK, and RVG: None.

Figures

Figure 1
Figure 1. Optical coherence tomography based microangiography (OMAG) images of a 49 year-old Asian male.
(A), fundus photograph of normal retina. (B), montaged OMAG images of the nerve fiber layer. Radial pericapillary network within the nerve fiber layer is noted. (C), the superficial retinal layer (SRL) slab contains the vascular network within the ganglion cell layer and the outer plexiform layer. The arcade vessels and the fine capillaries are shown. (D), the deep retinal layer (DRL) demonstrates deeper capillary network. (E), the whole retinal layer slab composed of the SRL, the DRL, and the outer retinal layer (ORL) allows visualization of the superficial, intermediate, and deep retinal capillary plexuses. Different colors identify various levels of the retina. (F), the magnified image of the central macula (identified as in the blue box from (E)). The cross-sectional flow image of the area marked with white dashed line on the magnified OMAG image. Blood flow detected in SRL, DRL, ORL in red, green, blue, respectively. No flow is appreciated in the ORL.
Figure 2
Figure 2. OMAG images of a 31 year-old male with proliferative diabetic retinopathy.
(A), fundus photo of proliferative diabetic retinopathy in the left eye. There are multiple, large fibrovascular complexes associated with pre- and intraretinal hemorrhages. (B), the late frame of the fluorescein angiography demonstrates diffuse leakage from several areas of active neovascularization. (C), the OMAG image of the whole retinal layer shows three large neovascular complexes that have penetrated into the vitreous cavity. (D), the structural optical coherence tomography shows the disruption of internal limiting membrane by the neovascular complexes (dashed lines indicated with #1,2,3 in (C)) and their growth into the vitreous cavity. (E), high-definition details of the vascular complex such as the vessel caliber, volume, density of capillary network can be appreciated compared to the FA. The flow OMAG image shows the evidence of vascular flow within the superotemporal neovascularization of elsewhere marked with a white dashed box in (C).
Figure 3
Figure 3. OMAG images of severe non-proliferative diabetic retinopathy in a 31 year-old male.
(A), fundus photo of severe nonproliferative diabetic retinopathy in the right eye shows several intraretinal hemorrhages and microaneurysms (MA). (B,C), the early and late frames of the fluorescein angiography show diffuse late leakage from MA’s. (D), an enlarged and irregular foveal avascular zone (FAZ) is associated with several dilated vascular bulbs as shown on the whole retinal OMAG image. There is no blockage from hemorrhage on the OMAG scan (arrow). (E), the magnified OMAG image of central macula marked with white dashed box in (D). Microaneurysms identified in the inverted display of OMAG image (dark appearance) show excellent agreement with those identified in FA image. The flow image shows decreased flow in both superficial and deep layers in the nasal fovea (+) compared to the temporal fovea (*).
Figure 4
Figure 4. Imaging of branch retinal vein occlusion (BRVO) in the left eye of a 68 year-old female.
(A), the fundus photo of the left eye shows several hemorrhages and edema in the superotemporal macula. (B), the arteriovenous phase of the fluorescein angiography shows leakage in the area of the BRVO. (C), the optical coherence tomography shows intraretinal fluid. (D), the whole retinal layer optical OMAG image illustrates a large area of capillary dropout and vascular irregularity in the superotemporal macula. (E), the flow image shows the evidence of interrupted flow within the deep retina layer associated with cystoid macular edema (*).
Figure 5
Figure 5. Imaging of a 43 year-old female with retinitis pigmentosa.
(A), the fundus photo of the right eye accompanied with spectral domain OCT shows the atrophy of the outer retina and pigmentary changes in the mid periphery. (B), the OMAG image of the whole retinal layer demonstrates the absence of normal vasculature within the superficial and deeper retinal layer outside the central macula. The box indicates the magnified area shown in (D). (C), the choroid slab delineates the area where the outer retina and retinal vasculature integrity is intact. The box indicates the magnified area shown in (D). (D), the flow image of the area indicated by the dashed line of the retinal and choroid OMAG images shows relative absence of vascular flow within the deep retinal layer where there is outer retinal loss. (The outer retina is intact to the right of the arrow).
Figure 6
Figure 6. Imaging of polypoidal choroidal vasculopathy (PCV) in a 50 year-old female.
(A), fundus photograph of the left eye shows a peripapillary, orangish mass under the retina (arrow). (B,C), the early and late frames of the indocyanine green angiography (ICG) demonstrates an active polyp. (D), the choriocapillaries and choroid slab shows a well-defined polyp located above choriocapillaries. (E), magnified OMAG and ICG image of the area marked by dashed white box in (D). The flow image shows blood flow within the active polyp.
Figure 7
Figure 7. Imaging of polypoidal choroidal vasculopathy (PCV) before and after treatment with anti-vascular endothelial growth factor (anti-VEGF).
(A), the indocyanine green angiography of the left eye. (B), cross-sectional image of the polyp and en face images of the polyp dissected at three different levels (yellow, dashed lines) (C), the optical coherence tomography image of the polyp before treatment. (D), the optical coherence tomography image of the polyp and reduction of the subretinal fluid after treatment with anti-VEGF. (E,F), enface images of the polypoidal lesion before and after treatment with anti-VEGF.

References

    1. Huang D. et al. Optical coherence tomography. Science 254, 1178–1181 (1991). - PMC - PubMed
    1. Keane P. A., Mand P. S., Liakopoulos S., Walsh A. C. & Sadda S. R. Accuracy of retinal thickness measurements obtained with Cirrus optical coherence tomography. Br J Ophthalmol 93, 1461–1467 (2009). - PubMed
    1. Rofagha S. et al. Seven-year outcomes in ranibizumab-treated patients in ANCHOR, MARINA, and HORIZON: a multicenter cohort study (SEVEN-UP). Ophthalmology 120, 2292–2299 (2013). - PubMed
    1. Brown D. M. et al. Long-term outcomes of ranibizumab therapy for diabetic macular edema: the 36-month results from two phase III trials: RISE and RIDE. Ophthalmology 120, 2013–2022 (2013). - PubMed
    1. Davis M. D. et al. Comparison of time-domain OCT and fundus photographic assessments of retinal thickening in eyes with diabetic macular edema. Invest. Ophthalmol. Vis. Sci. 49, 1745–1752 (2008). - PMC - PubMed

Publication types