. 2016 Feb 25:7:10688.
doi: 10.1038/ncomms10688.

Chlamydia trachomatis from Australian Aboriginal people with trachoma are polyphyletic composed of multiple distinctive lineages

Affiliations

Chlamydia trachomatis from Australian Aboriginal people with trachoma are polyphyletic composed of multiple distinctive lineages

Patiyan Andersson et al. Nat Commun. .

Abstract

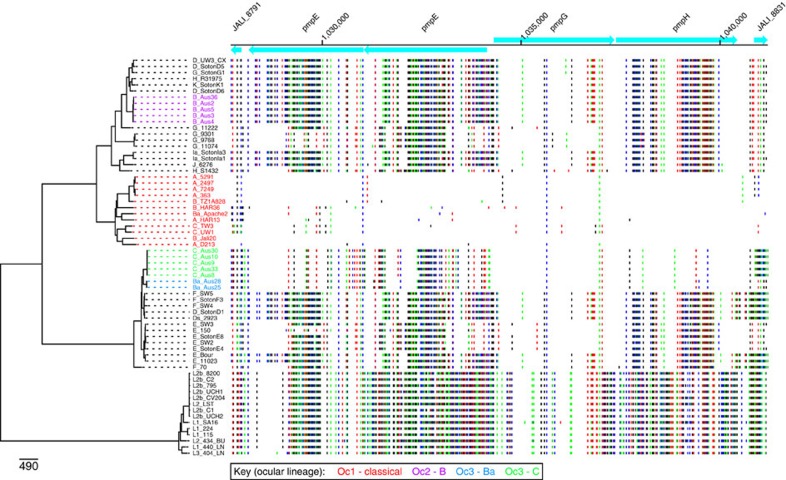
Chlamydia trachomatis causes sexually transmitted infections and the blinding disease trachoma. Current data on C. trachomatis phylogeny show that there is only a single trachoma-causing clade, which is distinct from the lineages causing urogenital tract (UGT) and lymphogranuloma venerum diseases. Here we report the whole-genome sequences of ocular C. trachomatis isolates obtained from young children with clinical signs of trachoma in a trachoma endemic region of northern Australia. The isolates form two lineages that fall outside the classical trachoma lineage, instead being placed within UGT clades of the C. trachomatis phylogenetic tree. The Australian trachoma isolates appear to be recombinants with UGT C. trachomatis genome backbones, in which loci that encode immunodominant surface proteins (ompA and pmpEFGH) have been replaced by those characteristic of classical ocular isolates. This suggests that ocular tropism and association with trachoma are functionally associated with some sequence variants of ompA and pmpEFGH.


Figures

Figure 1
Figure 1. C. trachomatis chromosomal phylogeny.
Maximum likelihood reconstruction of the phylogeny of C. trachomatis chromosomal sequences using orthologous SNPs, with inferred recombined regions removed. The ompA genotypes are included as the first letters in the designations of the isolates. The scale bar denotes number of SNPs. The established biovar-clusters are indicated on the right; with an ocular, a lymphogranuloma venerum (LGV) and two urogenital (UGT) clusters. The ocular clades are colour coded: Oc1 ‘classical ocular lineage' in red, Oc2 ompA genotype B Australian lineage in purple, Oc3 ompA genotype Ba Australian lineage in blue and Oc3 ompA genotype C Australian lineage in green. The novel ocular clades, Oc2 and Oc3 lie in clades that traditionally exclusively contain UGT strains.
Figure 2
Figure 2. SNP patterns of the ompA gene in Oc2 and Oc3 genotype C isolates.
SNP patterns in the region surrounding the ompA gene showing evidence for sharing of alleles between the Oc1 clade and the Oc2 or Oc3 lineages. The B/Jali20 genome (Genbank accession number NC012686) was used as the comparator genome. Genes are shown as blue boxes along the top with direction of transcription indicated by arrow heads, based on the B/Jali20 genome annotation. To the left, the chromosomal phylogeny (as in Fig. 1) indicates which genome is being compared with the B/Jali20 genome. Each horizontal line indicates a position where there is a SNP that separates the relevant genome sequence from the B/Jali20 genome sequence. The Oc2 clade has an ompA gene sequence most similar to the B/Har36 (indicated by red boxes), with the exception of the start of the gene, which is most similar to the two genotype H strains (indicated by the green boxes). The Oc3 ompA genotype C isolates have an ompA sequence most similar to that in the C/TW3 (blue boxes).
Figure 3
Figure 3. SNP patterns of the ompA gene in Oc3 genotype Ba isolates.
SNP patterns in the region surrounding the ompA gene showing evidence for sharing of alleles between the Oc1 clade and the Oc2 or Oc3 lineages. The B/Jali20 genome (Genbank accession number NC012686) was used as the comparator genome. Genes are shown as blue boxes along the top with direction of transcription indicated by arrow heads, based on the B/Jali20 genome annotation. To the left, the chromosomal phylogeny (as in Fig. 1) indicates which genome is being compared with the B/Jali20 genome. Each horizontal line indicates a position where there is a SNP that separates the relevant genome sequence from the B/Jali20 genome sequence. The genotype Ba isolates in the Oc3 clade have a fragment including an ompA sequence that is most similar to the Ba/Apache2 strain (indicated by the red box).
Figure 4
Figure 4. SNP patterns of pmpEFGH loci.
SNP patterns in the region including the pmpE, pmpF, pmpG, pmpH genes showing evidence for sharing of alleles between the Oc1 clade and the Oc2 or Oc3 lineages. The B/Jali20 genome (Genbank accession number NC012686) was used as the comparator genome. Genes are shown as blue boxes along the top with direction of transcription indicated by arrow heads, based on the B/Jali20 genome annotation. To the left, the chromosomal phylogeny (as in Fig. 1) indicates which genome is being compared with the B/Jali20 genome. Each horizontal line indicates a position where there is a SNP that separates the relevant genome sequence from the B/Jali20 genome sequence. The sequence of the isolates in the Oc3 clade show the highest similarity to the Oc1 clade, with the most striking resemblance observed for the pmpH gene.
Figure 5
Figure 5. PmpH amino acid phylogeny.
Maximum likelihood-inferred phylogeny of amino acid sequences for PmpH. The ocular clades are colour coded: Oc1 ‘classical ocular lineage' in red, Oc2 ompA genotype B Australian lineage in purple, Oc3 ompA genotype Ba Australian lineage in blue and ompA genotype C Australian lineage in green. The phylogeny shows a high similarity of the PmpH in Oc3 genotype Ba and C strains, with the PmpH in Oc1.
Figure 6
Figure 6. Genome-wide association study of the ocular phenotype.
Manhattan plot showing genome-wide association data comparing ocular strains (Oc1, Oc2 and Oc3) against all other strains (UGT and LGV). Each red dot in the graph is a SNP. The x axis shows the genomic position and summary gene annotations according to the reference strain B/Jali20 (NC012686). The y axis shows the −log10 of the Bonferroni corrected P-value for association for each SNP. Red arrows show the two regions of very strong association with the ocular phenotype, containing ompA and pmpEFGH, respectively.

References

    1. Mariotti S. P., Pascolini D. & Rose-Nussbaumer J. Trachoma: global magnitude of a preventable cause of blindness. Br. J. Ophthalmol. 93, 563–568 (2009). - PubMed
    1. WHO. Prevalence and Incidence of Selected Sexually Transmitted Infections World Health Organization (2011).
    1. Taylor H. R. (ed.). Trachoma: A Blinding Scourge from the Bronze Age to the Twenty-First Century Centre for Eye Research Australia (2008).
    1. Stephens R. S., Tam M. R., Kuo C. C. & Nowinski R. C. Monoclonal antibodies to Chlamydia trachomatis: antibody specificities and antigen characterization. J. Immunol. 128, 1083–1089 (1982). - PubMed
    1. Wang S. P., Kuo C. C., Barnes R. C., Stephens R. S. & Grayston J. T. Immunotyping of Chlamydia trachomatis with monoclonal antibodies. J. Infect. Dis. 152, 791–800 (1985). - PubMed

Publication types

Substances

LinkOut - more resources