. 2016 Mar 4;351(6277):1048-54.
doi: 10.1126/science.aad3439. Epub 2016 Feb 18.

Visualizing antibody affinity maturation in germinal centers

Affiliations

Visualizing antibody affinity maturation in germinal centers

Jeroen M J Tas et al. Science. .

Abstract

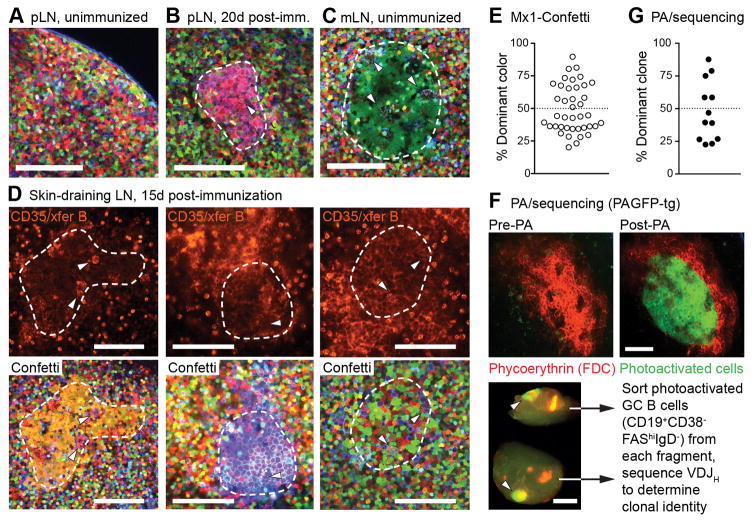
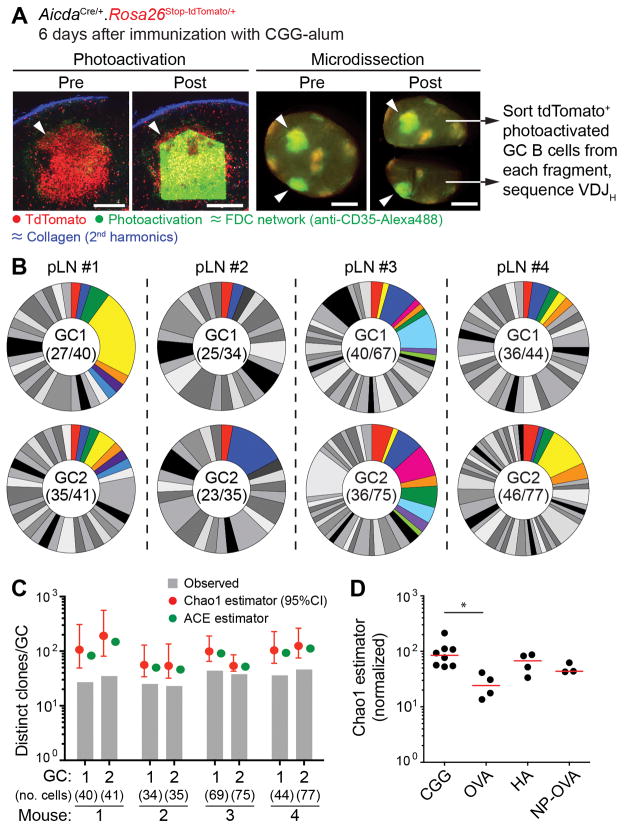
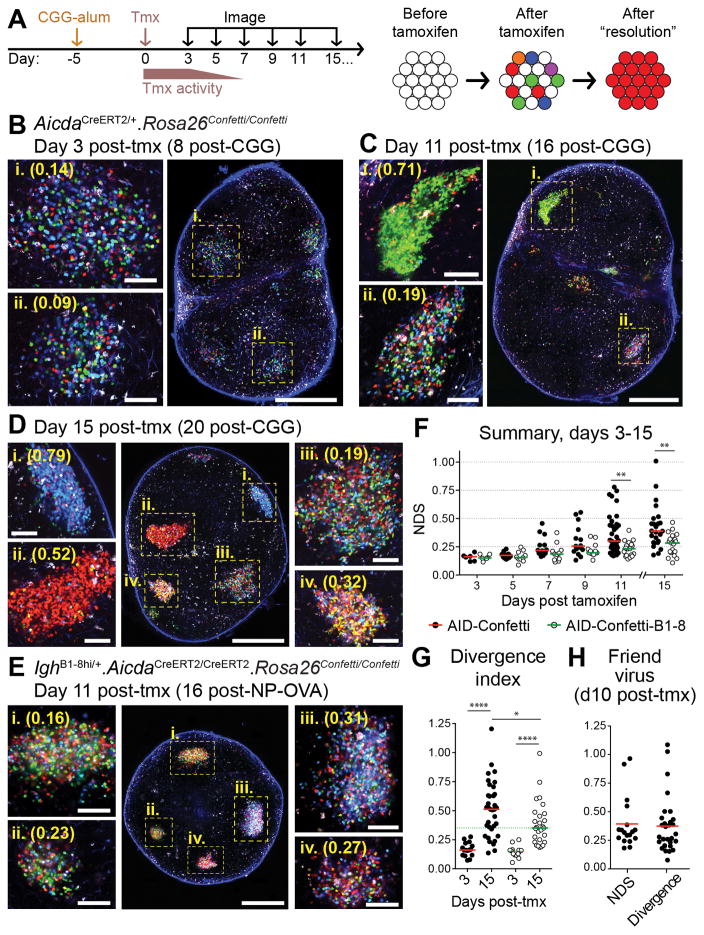
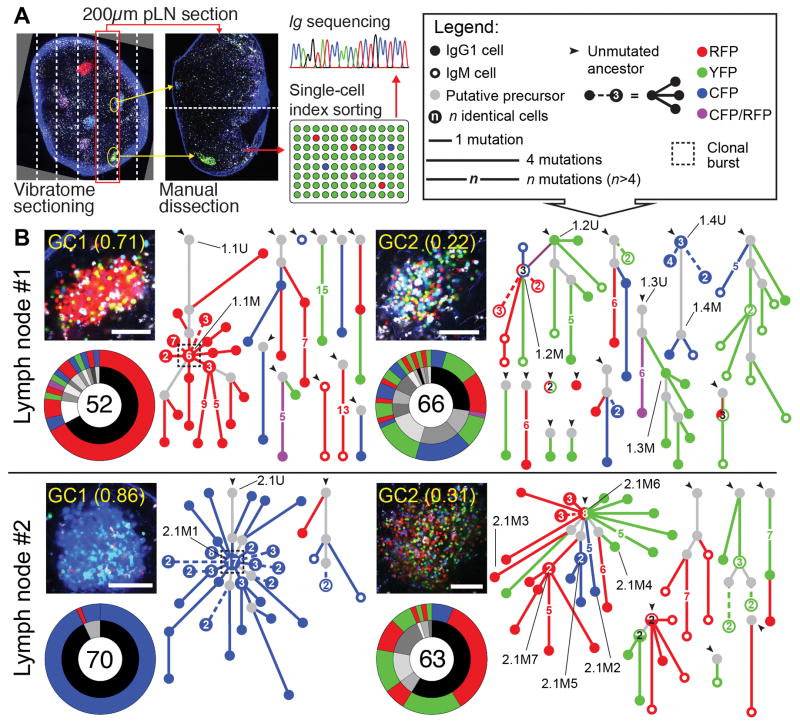
Antibodies somatically mutate to attain high affinity in germinal centers (GCs). There, competition between B cell clones and among somatic mutants of each clone drives an increase in average affinity across the population. The extent to which higher-affinity cells eliminating competitors restricts clonal diversity is unknown. By combining multiphoton microscopy and sequencing, we show that tens to hundreds of distinct B cell clones seed each GC and that GCs lose clonal diversity at widely disparate rates. Furthermore, efficient affinity maturation can occur in the absence of homogenizing selection, ensuring that many clones can mature in parallel within the same GC. Our findings have implications for development of vaccines in which antibodies with nonimmunodominant specificities must be elicited, as is the case for HIV-1 and influenza.


Figures

Figure 1
Figure 1. Visualizing clonal expansions in GCs using a brainbow allele
(A) Popliteal lymph node (pLN) of an unimmunized Rosa26Confetti/Confetti.Mx1-Cre mouse, imaged by multiphoton microscopy. (B) pLN of a mouse immunized 20 days previously with 10 μg CGG in alum in the hind footpad. The image shows a cluster of similar-colored cells corresponding to a GC (dashed line), as evidenced by the presence of tingible body macrophages (arrowheads). (C) Single-colored GC (dashed line) in a mesenteric lymph node (mLN) from an unimmunized mouse. (D) GCs in draining LN of mice immunized subcutaneously with CGG in alum 15 days prior to imaging. The location of the GC dark zone (dashed line) was determined by injection of labeled antibody to CD35 and surface-labeled naïve B cells (top panels, fluorescence is from Alexa 633 label). For each GC, Confetti colors (bottom panels) were imaged independently and used for quantification. Confetti colors are as shown in fig. S1B. GC identity is confirmed by presence of tingible-body macrophages (arrowheads). Scale bars, 100 μm. Second harmonic generation from collagen fibers is shown in blue. (E) Quantification of data as in (D). Each symbol represents one GC. Graph shows percentage of cells expressing the most abundant color combination. Data pooled from four mice, two independent experiments. (F) Quantifying GC clonality by photoactivation (PA). Photoactivatable-GFP-transgenic mice were immunized in the footpad with 10 μg CGG in alum and imaged 15 days later. FDC networks were labeled with phycoerytrhin immune complexes. Top, images of a single GC within a pLN, prior to and after photoactivation (Scale bar, 100 μm). Bottom, single pLN containing two photoactivated GCs (arrowheads) dissected into two fragments, each of which is separately processed for sorting of PA+ GC B cells and Igh sequencing (Scale bar, 500 μm). (G) Quantification of clonal dominance in multiple GCs. Data obtained as in (F), with clonal identity assigned based on Igh sequence. Each symbol represents one GC, with 2 GCs sequenced per LN (full clonality charts in fig. S2). Given is the percentage of cells belonging to the most abundant clone. Data are from 5 mice, 3 independent experiments.
Figure 2
Figure 2. Clonal diversity in early GCs
(A) Photoactivation of single early GC clusters. photo activatable-GFP-transgenic. AicdaCre. Rosa26lox-stop-lox-tdTomato mice were immunized in the footpad with 10 μg CGG in alum and imaged 6 days later. FDC networks were marked by injection of labeled antibody to CD35. Left panels show images of a single tdTomato+ cluster (arrowheads) within a pLN prior to and after photoactivation (Scale bar, 200 μm). Right panels show dissection of a single pLN with two photoactivated GCs (arrowheads) into two fragments, each of which is separately processed for cell sorting (Scale bar, 500 μm). (B) Pie charts showing clonal diversity in early GCs. Each slice represents one clone. Colored slices represent clones that were found in both GCs (upper and lower pie charts) from the same pLN. Numbers in the center of each chart are (number of clones observed/total number of cells sequenced). Clonal identity was assigned based on Igh sequence. Pairs are from 4 different mice in 3 independent experiments. (C) Estimation of total clonal richness in individual GCs using the Chao1 and ACE estimators. Graphs show observed clonal richness (from panel (B)), and total richness according to the indicated estimator. (D) Estimated clonal richness (Chao1) in GCs elicited by various antigens. Mice were immunized with 10 μg of the indicated antigen, and imaged/photoactivated as in (A). Each symbol represents one GC, bar indicates median. For comparison purposes, estimates are normalized by interpolation to the size of the smallest sample (34 cells). Note that numbers for CGG GCs in this panel differ from those in panel (C) due to normalization. Further details in Fig. S3. * p < 0.05, Kruskall-Wallis test with Dunn’s post-test. All other comparisons were not significant.
Figure 3
Figure 3. Kinetics of color dominance in individual GCs
(A) Graphic representation of the experimental protocol. AID-Confetti mice were immunized in the footpad with 10 μg CGG in alum, treated with tamoxifen (tmx) 5 days later, and imaged at the indicated time points. Tamoxifen triggers recombination of one or both Confetti alleles in individual GC B cells, independently of clonal origin. (B-E) Whole lymph node (large panel; scale bar, 500 μm) and higher-magnification images (side panels; scale bar, 100 μm) showing GCs at different times after tmx administration. Cell colors as in fig. S1B. Second harmonic generation from collagen fibers is shown in blue. (B-D), AID-Confetti mice imaged at the time points indicated. (E) WT recipients of 1–2 × 10⁴ adoptively-transferred AID-Confetti-B1-8 Igλ+ B cells, immunized with NP-OVA as in (A) and imaged 11 days post-tmx. Higher-magnification panels show independently-acquired images of the GCs indicated in the overview panel. (F) Quantification of data as shown in (B-E). NDS, normalized dominance score. Bars represent the median. (G) Divergence index for AID-Confetti and AID-Confetti-B1-8 mice at days 3 and 15 post-tmx. Bars represent the median. Green dotted line placed at the median of the day 15 AID-Confetti-B1-8 data for reference. (H) Quantification of GC selection in AID-Confetti mice infected with Friend Virus as detailed in fig. S7. Graph shows NDS and divergence index at day 10 post-tmx (day 30 post-infection). Bars represent the median. For panels (F-H), each symbol represents one GC. Data are pooled from 2–6 replicate experiments. For NDS quantification, we exclude GCs with density of fluorescent cells below 0.4 cells/100 μm2 (equivalent to approximately 40% of cells having recombined a Confetti allele; see Supplementary Text). * p<0.02; ** p < 0.01; **** p < 0.0001, Mann-Whitney U test.
Figure 4
Figure 4. Clonal relationships among cells obtained from GCs with high or low color dominance
(A) Method used to obtain Ig sequences. (B) Igh sequence relationship among B cells from 2 pairs of individual GCs from 2 pLNs of different mice, obtained 10 days after tamoxifen administration (15 days post-immunization), as described in Fig. 3. Each panel contains: top left, multiphoton image (scale bar, 100 μm, cell colors as in fig. S1B, second harmonic generation from collagen fibers is shown in blue); bottom left, clonal distribution pie-chart (with clones represented in grayscale in the inner ring and Confetti colors in the outer ring; number of cells sequenced is indicated in the center); and right, trees representing the phylogeny of Ig heavy-chain V-segment sequences within each clone (symbols according to the legend in the top right corner). Dashed lines within phylogenies indicate multiple variants distanced the same number of mutations from the originating node. IDs of variants for which affinity was measured in Fig. 5 are indicated by black lines. For each LN, GC1 and GC2 were considered as displaying high and low color dominance, respectively
Figure 5
Figure 5. Affinity maturation in GCs with high or low color dominance
Affinity measurements for reconstructed Fabs derived from B cell clones/variants indicated in Fig. 4B. (A) Binding of Fabs cloned from LN1 to IgY (right) or CGG (left), measured by ELISA. (B) Bio-layer interferometry for Fabs cloned from LN1 binding to IgY. (C) and (D) as in (A) and (B), respectively, but using Fabs cloned from LN#2. (E) Affinity for IgY among variants of clone 2.1 (Fig. 4B) from LN2/GC1 (blue) and LN2/GC2 (orange), shown as KD (top) and fold-change over UA (bottom). The unmutated ancestor (2.1U) is shown in gray. Open bars have the WT nucleotide (C) in the 119 position, closed bars have the C119>G (Ala>Gly) mutation. (F) Affinity of Fabs reconstructed from clone 2.1, either unmutated (gray lines) or with replacement of a single Igk nucleotide (C119>G (Ala>Gly), black lines). (C) Igk sequence relationships among B cells from clone 2.1 from LN2/GC1 (left) or LN2/GC2 (right). Symbols according to the legend below the figure and in Fig. 4B. Cloned Fab IDs are indicated by black lines. Note that, although not all cells yielded both Igk and Igh sequences, clonal relationships are drawn from all available data, and therefore exact correspondence between the trees in panel (G) and in Fig. 4B is not expected. Bio-layer interferometry was performed with Fabs at 20, 40, 80, and 160 nM. Panel (D) shows only the 160 nM measurement. Reported affinities are the average of two measurements fitted globally at the 20–160 nM range.

References

    1. Eisen HN, Siskind GW. Variations in Affinities of Antibodies During the Immune Response. Biochemistry. 1964 Jul;3:996. - PubMed
    1. Eisen HN. Affinity enhancement of antibodies: how low-affinity antibodies produced early in immune responses are followed by high-affinity antibodies later and in memory B-cell responses. Cancer Immunol Res. 2014 May;2:381. - PubMed
    1. MacLennan IC. Germinal centers. Annu Rev Immunol. 1994;12:117. - PubMed
    1. Rajewsky K. Clonal selection and learning in the antibody system. Nature. 1996 Jun 27;381:751. - PubMed
    1. Allen CD, Okada T, Cyster JG. Germinal-center organization and cellular dynamics. Immunity. 2007 Aug;27:190. - PMC - PubMed

Publication types