. 2016 Jun;1862(6):1122-36.
doi: 10.1016/j.bbadis.2016.02.008. Epub 2016 Feb 18.

The p21-activated kinase, PAK2, is important in the activation of numerous pancreatic acinar cell signaling cascades and in the onset of early pancreatitis events

Affiliations

The p21-activated kinase, PAK2, is important in the activation of numerous pancreatic acinar cell signaling cascades and in the onset of early pancreatitis events

Bernardo Nuche-Berenguer et al. Biochim Biophys Acta. 2016 Jun.

Abstract

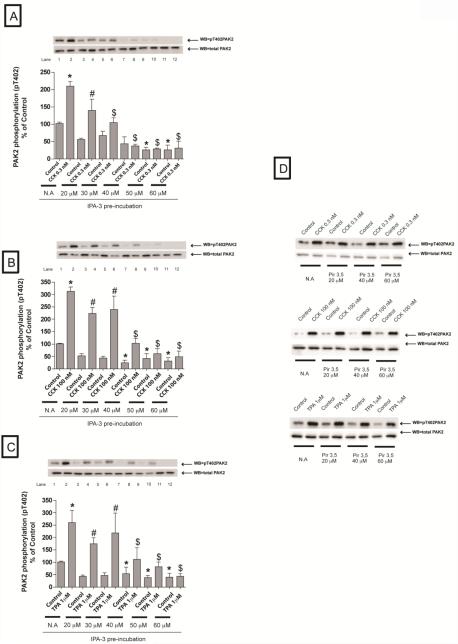
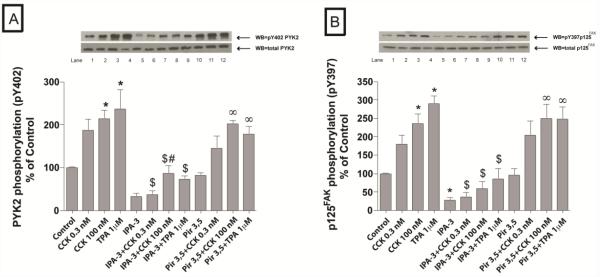
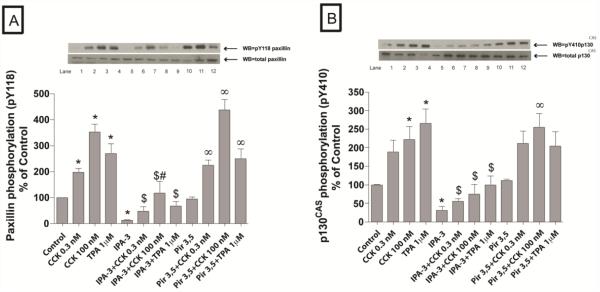
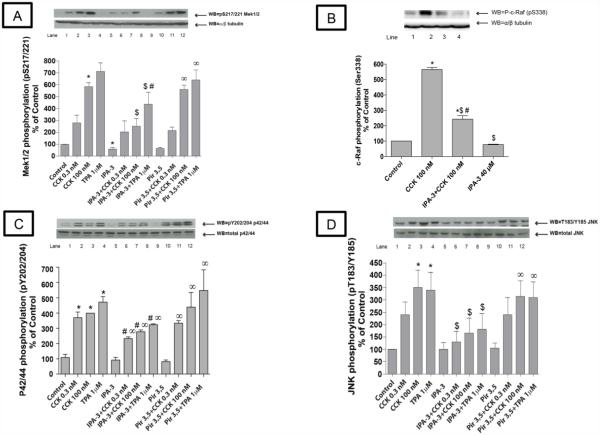
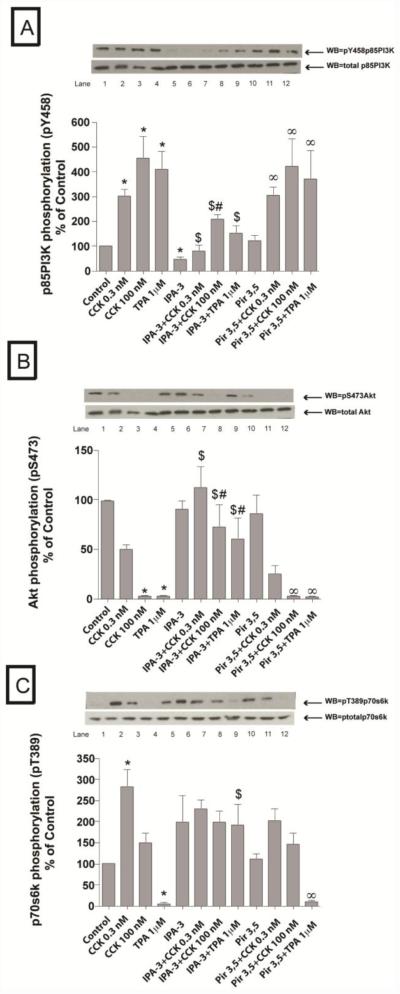
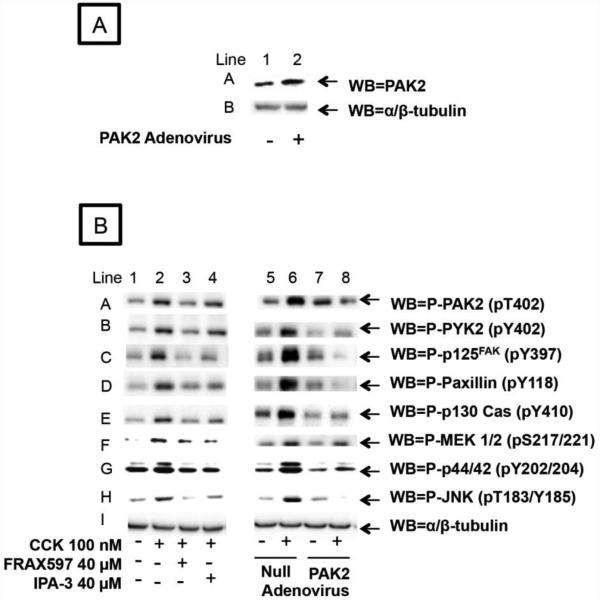
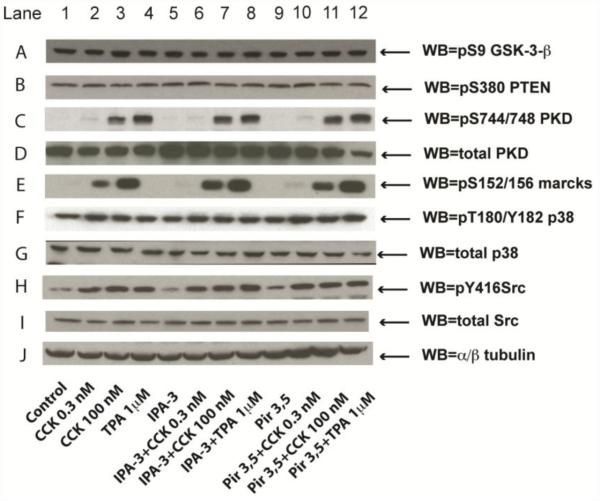
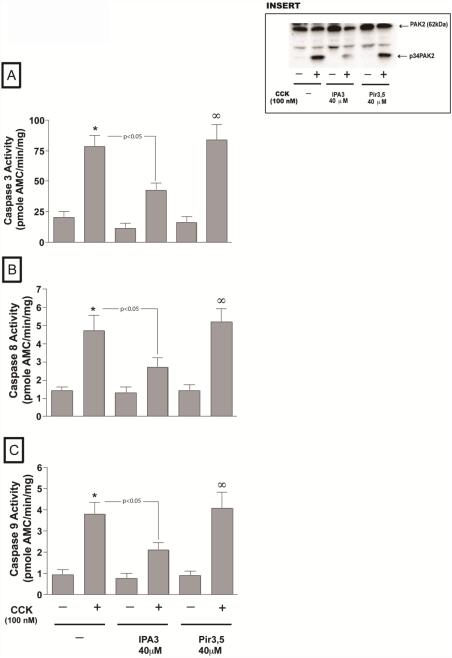
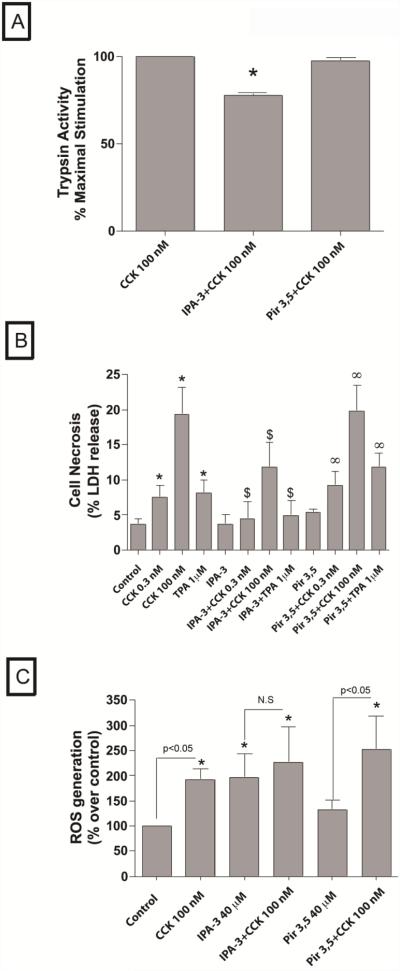
In a recent study we explored Group-1-p21-activated kinases (GP.1-PAKs) in rat pancreatic acini. Only PAK2 was present; it was activated by gastrointestinal-hormones/neurotransmitters and growth factors in a PKC-, Src- and small-GTPase-mediated manner. PAK2 was required for enzyme-secretion and ERK/1-2-activation. In the present study we examined PAK2's role in CCK and TPA-activation of important distal signaling cascades mediating their physiological/pathophysiological effects and analyzed its role in pathophysiological processes important in early pancreatitis. In rat pancreatic acini, PAK2-inhibition by the specific, GP.1.PAK-inhibitor, IPA-3-suppressed cholecystokinin (CCK)/TPA-stimulated activation of focal-adhesion kinases and mitogen-activated protein-kinases. PAK2-inhibition reversed the dual stimulatory/inhibitory effect of CCK/TPA on the PI3K/Akt/GSK-3β pathway. However, its inhibition did not affect PKC activation. PAK2-inhibition protected acini from CCK-induced ROS-generation; caspase/trypsin-activation, important in early pancreatitis; as well as from cell-necrosis. Furthermore, PAK2-inhibition reduced proteolytic-activation of PAK-2p34, which is involved in programmed-cell-death. To ensure that the study did not only rely in the specificity of IPA-3 as a PAK inhibitor, we used two other approaches for PAK inhibition, FRAX597 a ATP-competitive-GP.1-PAKs-inhibitor and infection with a PAK2-dominant negative(DN)-Advirus. Those two approaches confirmed the results obtained with IPA-3. This study demonstrates that PAK2 is important in mediating CCK's effect on the activation of signaling-pathways known to mediate its physiological/pathophysiological responses including several cellular processes linked to the onset of pancreatitis. Our results suggest that PAK2 could be a new, important therapeutic target to consider for the treatment of diseases involving deregulation of pancreatic acinar cells.

Keywords: CCK; Cell death; FRAX597; IPA-3; PAK2; PAK2-DN-advirus; Pancreatic acini; Pancreatitis; Signaling.


Figures

Fig. 1
Fig. 1. Effect of increasing concentrations of the active PAK2 inhibitor, IPA-3, and its inactive control, Pir 3,5, on PAK2 activation by CCK or TPA
Rat pancreatic acinar cells were pretreated with no additions or with IPA-3 (20, 30, 40, 50 and 60 μM) or Pir 3,5 (20, 40 and 60 μM) for 15 min and then incubated with no additions (control), with 0.3 nM CCK or 100 nM CCK for 3 min or with 1 μM TPA for 5 min and then lysed. Whole cell lysates were submitted to SDS-PAGE and transferred to nitrocellulose membranes. Membranes were analyzed using anti-pT402 PAK2 and total PAK2 was used to verify loading of equal amounts of protein. The bands were visualized using chemoluminescence and quantification of phosphorylation was assessed using scanning densitometry. Both a representative experiment of 4 others and the means of all the experiments are shown. * P< 0.05 vs. control, # P< 0.05 vs. IPA-3 alone, and $ P< 0.05 comparing stimulants (CCK or TPA) preincubated with 1% DMSO vs. stimulants pre-incubated with IPA-3.
Fig. 2
Fig. 2. Effect of IPA-3 and Pir 3,5 on the ability of physiological (0.3 nM) and supraphysiological (100 nM) concentrations of CCK and TPA (1 μM) to stimulate various kinases of the focal adhesion pathway (PYK2 and p125FAK)
Rat pancreatic acinar cells were pretreated with no additions or with IPA-3 (40 μM) or Pir 3,5 (40 μM) for 15 min and then incubated with no additions (control), with 0.3 nM CCK or 100 nM CCK for 3 min or with 1 μM TPA for 5 min and then lysed. Whole cell lysates were submitted to SDS-PAGE and transferred to nitrocellulose membranes. Membranes were analyzed using anti-pY402 PYK2 and anti-pY397 p125FAK. Antibodies detecting total amount of these kinases were used to verify loading of equal amounts of protein. The bands were visualized using chemoluminescence and quantification of phosphorylation was assessed using scanning densitometry. Both a representative experiment of 4 others and the means of all the experiments are shown. * P< 0.05 vs. control, # P< 0.05 vs. IPA-3 alone, ∞ P< 0.05 vs. Pir 3,5 alone and $ P< 0.05 comparing stimulants (CCK or TPA) preincubated with 1% DMSO vs. stimulants pre-incubated with IPA-3 or Pir 3,5, respectively.
Fig. 3
Fig. 3. Effect of IPA-3 and Pir 3,5 on the ability of physiological (0.3 nM) and supraphysiological (100 nM) concentrations of CCK and TPA (1μM) to stimulate various adapter proteins (paxillin and p130CAS)
Rat pancreatic acinar cells were processed as stated in Figure 2. Membranes were analyzed using anti-pY118 paxillin and anti-pY410 p130CAS. Antibodies detecting total amount of these kinases were used to verify loading of equal amounts of protein. The bands were visualized using chemoluminescence and quantification of phosphorylation was assessed using scanning densitometry. Both a representative experiment of 4 others and the means of all the experiments are shown. * P< 0.05 vs. control, # P< 0.05 vs. IPA-3 alone, ∞ P< 0.05 vs. Pir 3,5 alone and $ P< 0.05 comparing stimulants (CCK or TPA) preincubated with 1% DMSO vs. stimulants pre-incubated with IPA-3 or Pir 3,5, respectively.
Fig. 4
Fig. 4. Effect of the PAK2 inhibitor, IPA-3 and its inactive analogue Pir 3,5 on the ability of physiological (0.3 nM) and supraphysiological concentrations of CCK (100 nM) and TPA to stimulate various kinases in the mitogen-activated kinases pathway (Mek 1/2, c-raf, p42/44 and JNK)
Rat pancreatic acinar cells were processed as stated in Figure 2. Membranes were analyzed using anti-pS217/221 Mek1/2, anti pS338-Raf, anti p-Y202/204 p42/44 and anti-p T183/Y185 JNK. Antibodies detecting total amount of these kinases or tubulin were used to verify loading of equal amounts of protein. The bands were visualized using chemoluminescence and quantification of phosphorylation was assessed using scanning densitometry. Both a representative experiment of 4 others and the means of all the experiments are shown. * P< 0.05 vs. control, # P< 0.05 vs. IPA-3 alone, ∞ P< 0.05 vs. Pir 3,5 alone and $ P< 0.05 comparing stimulants (CCK or TPA) preincubated with 1% DMSO vs. stimulants pre-incubated with IPA-3 or Pir 3,5, respectively.
Fig. 5
Fig. 5. Effect of the PAK2 inhibitor, IPA-3 and its inactive analogue Pir 3,5 on the ability of physiological (0.3 nM) and supraphysiological concentrations of CCK (100 nM) and TPA to stimulate various kinases in the PI3K pathway (p85, Akt and P70S6k)
Rat pancreatic acinar cells were processed as stated in Figure 2. Membranes were analyzed using anti-pY458 p85, anti-S473 Akt and anti-T389 P70S6k. Antibodies detecting total amount of these kinases or tubulin were used to verify loading of equal amounts of protein. The bands were visualized using chemoluminescence and quantification of phosphorylation was assessed using scanning densitometry. Both a representative experiment of 4 others and the means of all the experiments are shown. * P< 0.05 vs. control, # P< 0.05 vs. IPA-3 alone, ∞ P< 0.05 vs. Pir 3,5 alone and $ P< 0.05 comparing stimulants (CCK or TPA) preincubated with 1% DMSO vs. stimulants pre-incubated with IPA-3 or Pir 3,5, respectively.
Fig. 6
Fig. 6. Effect of pre-incubation with PAK dominant negative and control adenovirus upon the expression of PAK2, in pancreatic acinar cells, and the effect of the PAK2 inhibitors, FRAX597 and IPA-3, and the dominant negative PAK2 adenovirus on the ability of CCK 100 nM to stimulate the downstream effectors of PAK2 (Focal Adhesion Kinases and Mitogen Activated Protein Kinases pathways)
A. Rat pancreatic acinar cells were pre-incubated for 6 h without (Line 1) or with (Line 2) 109 VP/ml of DN-PAK2-Advirus or wild type adenovirus. This experiment is representative of 3 others. B. Rat pancreatic acinar cells were processed as stated in Figure 2, except that 40 µM FRAX597 was also added during a 15 minutes pre-incubation as described in Material and Methods. Dominant negative PAK2 adenovirus or Null adenovirus were added 6 hours prior to stimulants which were added for 5 minutes. Membranes were analyzed using anti-pT402-PAK2, anti-pT402-PYK2, anti-pY397-p125FAK, anti-pY118-Paxillin, anti-pY410-p130 Cas, anti-pS217/221-MEK 1/2, anti-pY202/204-p44/42, and anti-pT183/Y185-JNK. Anti-α/β-tubulin was used to verify loading of equal amounts of protein. These results of the experiments shown are representative of 3 others.
Fig. 7
Fig. 7. Effect of the PAK2 inhibitor, IPA-3 and its inactive control, Pir 3,5 on the ability of physiological (0.3 nM) and supraphysiological concentrations of CCK (100 nM) and TPA to stimulate the PKC pathway (PKD, Marcks), PTEN, p38, Src and GSK-3β
Rat pancreatic acinar cells were processed as stated in Figure 2. Membranes were analyzed using anti-pS9 GSK-3-β, anti-p-S380 PTEN, anti-pS744/748 PKD, pS152/156 Marcks, anti-pY183 p38 and anti-pY416 Src. Antibodies detecting total amount of these kinases or tubulin were used to verify loading of equal amounts of protein. These results of the experiments shown are representative of 4 others.
Fig. 8
Fig. 8. Effect of inhibition of PAK2 on CCK-mediated apoptosis in pancreatic acini
Freshly isolated rat pancreatic acini were pre-incubated with either 40 μM IPA-3 or Pir 3,5 for 3 hours. Caspase (caspase 3, 8, 9) activities were measured as described in Materials and Methods in the lysates of isolated pancreatic acini. The results are representative of 4 independent (n=4) experiments. Results shown are the means ± SEM., * P< 0.05, comparing control, $ P<0.05 vs. Pir 3,5 alone. The generation of the active p34PAK2 form by the 3 hours incubation with CCK was also analyzed by western blotting (insert).
Fig. 9
Fig. 9. Effect of inhibition of PAK2 on CCK- induced trypsin activation and CCK-mediated cell necrosis in pancreatic acini
A. Freshly isolated rat pancreatic acini were pre-incubated with either 40 μM IPA-3 or Pir 3,5 for 1 hour followed by stimulation with 0.3 and 100 nM CCK and 1 μM TPA for 20 minutes. Trypsin activity was measured as described in Materials and Methods in the lysates of isolated pancreatic acini. The results are representative of 4 independent (n=4) experiments. The data are expressed as the percentage of maximal activity obtained when acini were incubated for 20 min with 100 nM CCK. Results shown are the means ± SEM., * P< 0.05, comparing CCK-maximal stimulation. B. Freshly isolated rat pancreatic acini were pre-incubated with either 40 μM IPA-3 or Pir 3,5 for 1 hour followed by stimulation with 0.3 and 100 nM CCK and 1 μM TPA for 1 hour. LDH release was measured as described in Materials and Methods in the supernatants of isolated pancreatic acini. The results are representative of 4 independent (n=4) experiments. Results shown are the means ± SEM., * P< 0.05, comparing control, $ P<0.05 comparing stimulants (CCK or TPA) preincubated with 1% DMSO vs. stimulants pre-incubated with IPA-3 or Pir 3,5, respectively, ∞ P<0.05 vs. Pir 3,5 control. C. Experimental conditions were the same as reported in Fig. Legend. ROS generation was measured as described in Materials and Methods in cell suspensions of isolated pancreatic acini. The results are representative of 6 independent (n=6) experiments. Results shown are the means ± SEM., * P< 0.05, comparing control (data on 0.3nM CCK and TPA are not shown.
Fig. 10
Fig. 10. Effect of the PAK2 inhibitors, FRAX597 and IPA-3, on CCK-mediated apoptosis in pancreatic acini
Freshly isolated rat pancreatic acini were pre-incubated with either 40 μM FRAX597 or IPA-3 (40 μM ) for 1 hour and incubated for 3 hours with (CCK 100 nM). Caspase (caspase 3, 8, 9) activities were measured as described in Materials and Methods in the lysates of isolated pancreatic acini and in Fig. 8 legend. The results are representative of 3 independent (n=3) experiments. Results shown are the means ± SEM., * P< 0.05, comparing control.
Fig. 11
Fig. 11. Effect of the PAK2 inhibitors, FRAX597 and IPA-3, on CCK- induced trypsin activation and CCK-mediated cell necrosis in pancreatic acini
A. Freshly isolated rat pancreatic acini were pre-incubated with either 40 μM FRAX597 or IPA-3 (40 μM) for 1 hour followed by stimulation with 100 nM CCK for 20 minutes. Trypsin activity was measured as described in Materials and Methods in the lysates of isolated pancreatic acini. The results are representative of 3 independent (n=3) experiments. The data are expressed as the percentage of maximal activity obtained when acini were incubated for 20 min with 100 nM CCK. Results shown are the means ± SEM., * P< 0.05, comparing CCK-maximal stimulation. B. Freshly isolated rat pancreatic acini were pre-incubated with either 40 μM FRAX597 or IPA-3 (40 μM) or for 1 hour followed by stimulation with 100 nM CCK for 1 hour. LDH release was measured as described in Materials and Methods in the supernatants of isolated pancreatic acini. The results are representative of 3 independent (n=3) experiments. Results shown are the means ± SEM., * P< 0.05, comparing control. C. Freshly isolated rat pancreatic acini were pre-incubated as shown in Figure 9C. ROS generation was measured as described in Materials and Methods and in Fig. 9C legend in cell suspensions of isolated pancreatic acini. The results are representative of 4 independent (n=4) experiments. Results shown are the means ± SEM., * P< 0.05, comparing control.
Fig. 12
Fig. 12. Schematic diagram of signaling role of PAK2 in pancreatic acinar cells
In rat pancreatic acinar cells CCK-induced PAK2 activation is mediated by activation of CDC42/Rac1, Src and PKC [8]. Activation of PAK2 is needed to stimulate several signaling kinases including MAPKs (p42/44, JNK), FAKs (p125FAK, PYK2) and scaffolding proteins (paxillin, p130CAS) that are important in mediating numerous cellular functions. Activation of PAK2 has a unique dual role in altering activity of the PI3K-Akt pathway being required for stimulation of p85, but also mediating inhibition of AKT activity via dephosphorylation of Akt, which a previous study proposes requires activation of phosphatases in a PKC-dependent manner [33].

Similar articles

Cited by

References

    1. Bokoch GM. Biology of the p21-activated kinases. Annu. Rev Biochem. 2003;72:743–781. - PubMed
    1. Rane CK, Minden A. P21 activated kinases: Structure, regulation, and functions. Small GTPases. 2014;5 - PMC - PubMed
    1. Ye DZ, Field J. PAK signaling in cancer. Cell Logist. 2012;2:105–116. - PMC - PubMed
    1. Zhao ZS, Manser E. PAK family kinases: Physiological roles and regulation. Cell Logist. 2012;2:59–68. - PMC - PubMed
    1. Wong LL, Lam IP, Wong TY, Lai WL, Liu HF, Yeung LL, Ching YP. IPA-3 inhibits the growth of liver cancer cells by suppressing PAK1 and NF-kappaB activation. PLoS. ONE. 2013;8:e68843. - PMC - PubMed

Publication types