. 2016 Apr 15;291(16):8836-47.
doi: 10.1074/jbc.M115.707901. Epub 2016 Feb 24.

Allosteric Inhibition of Bcr-Abl Kinase by High Affinity Monobody Inhibitors Directed to the Src Homology 2 (SH2)-Kinase Interface

Affiliations

Allosteric Inhibition of Bcr-Abl Kinase by High Affinity Monobody Inhibitors Directed to the Src Homology 2 (SH2)-Kinase Interface

John Wojcik et al. J Biol Chem. .

Abstract

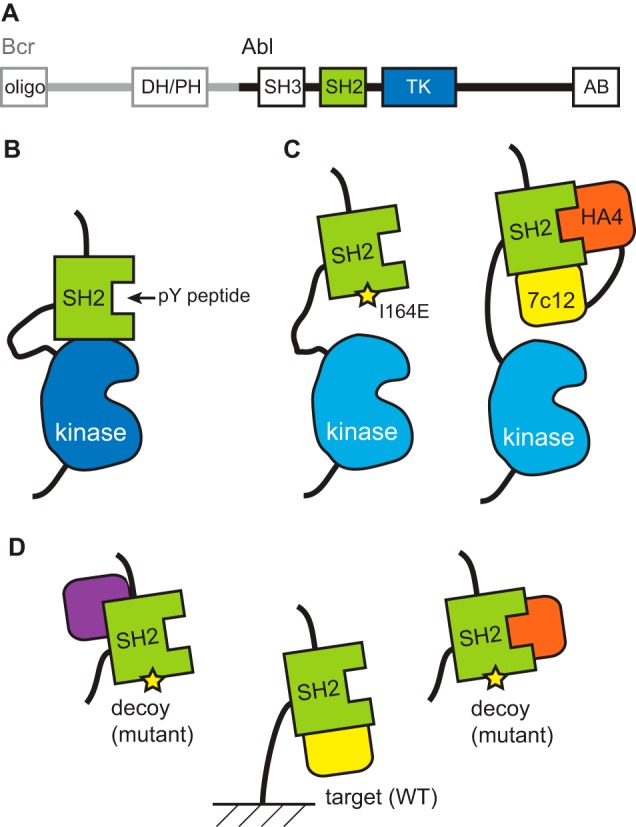
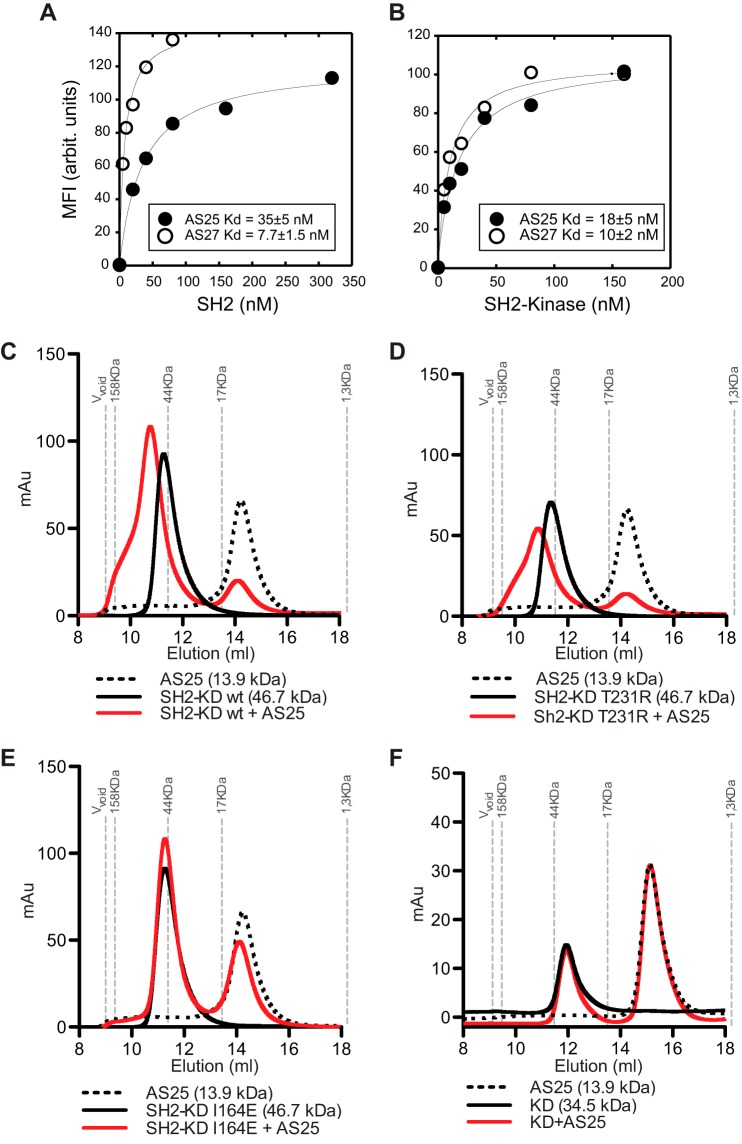
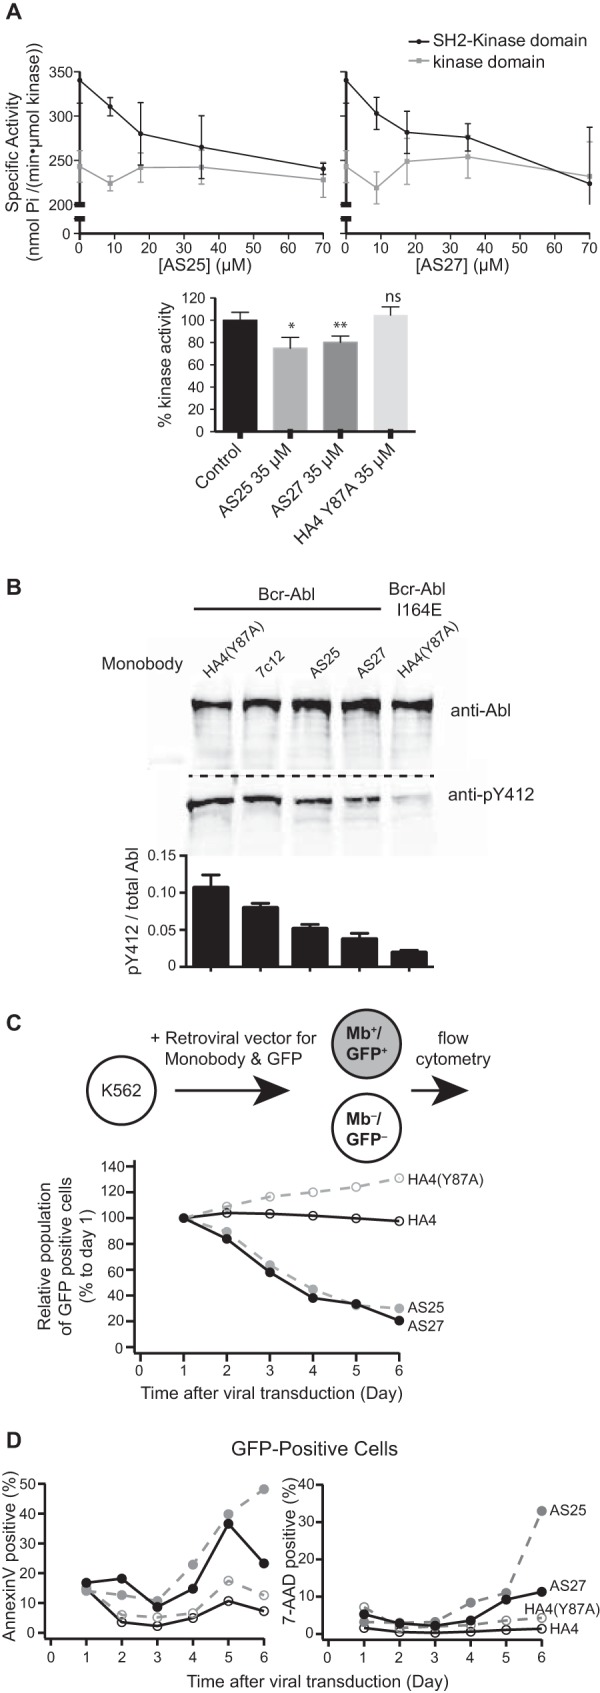
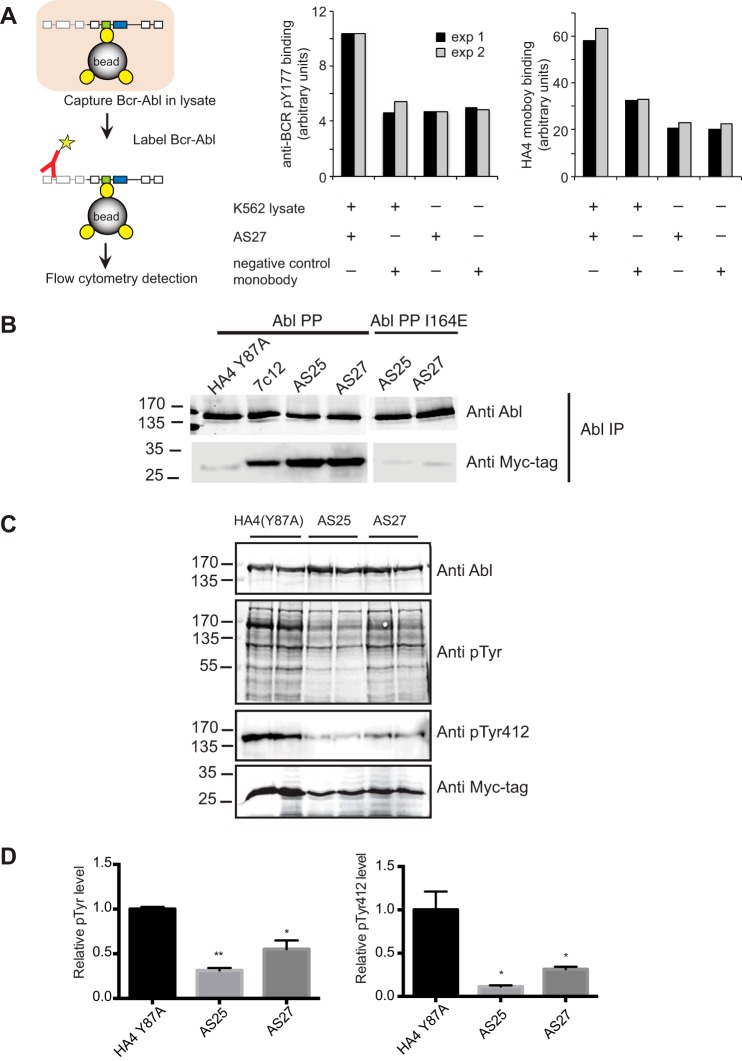
Bcr-Abl is a constitutively active kinase that causes chronic myelogenous leukemia. We have shown that a tandem fusion of two designed binding proteins, termed monobodies, directed to the interaction interface between the Src homology 2 (SH2) and kinase domains and to the phosphotyrosine-binding site of the SH2 domain, respectively, inhibits the Bcr-Abl kinase activity. Because the latter monobody inhibits processive phosphorylation by Bcr-Abl and the SH2-kinase interface is occluded in the active kinase, it remained undetermined whether targeting the SH2-kinase interface alone was sufficient for Bcr-Abl inhibition. To address this question, we generated new, higher affinity monobodies with single nanomolar KD values targeting the kinase-binding surface of SH2. Structural and mutagenesis studies revealed the molecular underpinnings of the monobody-SH2 interactions. Importantly, the new monobodies inhibited Bcr-Abl kinase activity in vitro and in cells, and they potently induced cell death in chronic myelogenous leukemia cell lines. This work provides strong evidence for the SH2-kinase interface as a pharmacologically tractable site for allosteric inhibition of Bcr-Abl.

Keywords: ABL tyrosine kinase; FN3; PPI inhibitor; Src homology 2 domain (SH2 domain); enzyme inhibitor; protein engineering; protein-protein interaction; x-ray crystallography.


Figures

FIGURE 1.
FIGURE 1.
Domain architecture (A) and SH2-dependent regulatory mechanism of Bcr-Abl are shown. B and C, schematic drawings of the interface between the SH2 and kinase domains and disruptions of the interface with the I164E mutation or with the tandem monobodies. D, scheme showing a strategy for recovering monobodies binding to a predefined epitope using a decoy containing a mutation in the desired epitope. By adding the decoy in large excess over the immobilized target, monobodies binding outside the desired surface are preferentially bound to the decoys, leading to enrichment of desired monobodies (shown in yellow). PH, pleckstrin homology domain; DH, Dbl homology domain; TK, tyrosine kinase domain; AB, actin-binding domain.
FIGURE 2.
FIGURE 2.
Monobodies binding to the Abl SH2 domain. A, the amino acid sequences of the monobody libraries and monobody clones. In the library designs, “X” denotes a mixture of 30% Tyr, 15% Ser, 10% Gly, 5% Phe, 5% Trp, and 2.5% each of all the other amino acids except for Cys; “B” denotes a mixture of Gly, Ser, and Tyr; “J” denotes a mixture of Ser and Tyr; “O” denotes a mixture of Asn, Asp, His, Ile, Leu, Phe, Tyr, and Val; “U” denotes a mixture of His, Leu, Phe, and Tyr; and “Z” denotes a mixture of Ala, Glu, Lys, and Thr. A hyphen indicates a deletion. B, a schematic drawing of the monobody scaffold and the locations of diversified positions in the libraries. A and B are modified from Figs. 2 and 1, respectively, of Koide et al. (11).
FIGURE 3.
FIGURE 3.
Biochemical analysis of monobody binding to Abl kinase fragments. A, binding of monobodies to Abl SH2 domain as tested in the yeast surface display format. Binding signal in terms of mean fluorescence intensity (MFI) in arbitrary (arbit.) units is plotted versus SH2 concentration. The curves are the best fit of the 1:1 binding model. The KD values are shown. The errors are the S.D. from nonlinear least square fitting. B, binding of monobodies to the SH2-kinase fragment as tested in the yeast surface display format shown in the same manner as in A. C–F, size exclusion chromatography analysis of complex formation of the AS25 monobody with wild type (C), T231R (D), and I164E (E) of the SH2-KD segment (C–E) and the wild-type KD (F) of Abl. mAu, milli-absorbance units.
FIGURE 4.
FIGURE 4.
Structures and interactions of the Abl SH2 domain with monobodies. A, the crystal structure of the SH2-kinase fragment of Abl in the active conformation (Protein Data Bank code 1OPL; chain B). The bottom picture shows the surface of the SH2 domain with the footprint of the kinase domain in red as defined as surfaces of the atoms located within 5 Å of the kinase domain. A predicted location of a phospho-Tyr peptide based on homology to other SH2 domains is shown as the yellow object. Ile-164 is shown as a stick model. B, NMR-based epitope mapping of four monobodies. The red, yellow, and gray spheres show residues of Abl SH2 whose amide resonances in the 1H,15N HSQC spectrum were strongly affected (shift of ≥1.5 peak width), weakly affected (shift of 0.5–1.5 peak width), and minimally affected (shift of b0.5 peak width) by monobody binding, respectively. C–E, the crystal structures of the SH2 domain in complex with GG3 (C), AS25 (D), and 7c12 (E; Protein Data Bank code 3T04). The SH2 domain in the schematic models on the left is in the same orientation as that in A. The right schematic models are from an orthogonal viewing angle. The spheres show diversified residues, and yellow, gray, and pink-red denote those in the BC, CD, DE, and FG loops, respectively. The footprints of the monobodies are shown in the same manner as in A.
FIGURE 5.
FIGURE 5.
The binding interfaces of the GG3 and AS25 complexes. A, a comparison of the binding modes of the two monobodies. The “back side” (the A, B, and E strands and loops adjacent to them) of the monobodies are omitted for clarity. The surface model shows the SH2 domain. The C and F strands and FG loop are labeled for comparison. The sphere shows Ile-88 that is the pivot point for the rotation relative to the β-sheet core of the two monobodies. B, the interaction of the FG loop of AS25 with SH2. The N-terminal half (YGYPY) of the loop is shown with carbon atoms in green. C, the interaction of the FG loop of GG3 with SH2 with the N-terminal half (LLSSS) shown with carbon atoms in green. D, Ala-scanning mutagenesis of AS25. The ΔΔG values are shown in the graph. The asterisks indicate that the ΔΔG values are the lower limit because the KD values for the mutants were too high to be determined in the assay. The “hot spot” residues with ΔΔG >3 kcal/mol are shown as red sticks. E, a portion of the AS25-SH2 interface depicting the unsatisfied charge of Arg-239 and three positions in the monobody where mutations increased the affinity. The graph shows binding titration curves measured in the yeast surface display format. arbit., arbitrary.
FIGURE 6.
FIGURE 6.
Inhibition of Bcr-Abl and Abl by monobodies. A, inhibition of Abl kinase activity in vitro. The activity of recombinant Abl kinase domain (gray) and Abl SH2-kinase domain unit (black) were assayed in the presence of the indicated concentrations of recombinant AS25 (left panel) or AS27 (right panel). The 0 μm AS25 and AS27 controls contained 70 μm HA4 harboring the Y87A mutation as a non-binding negative control (13). Specific activities for phosphorylation of an optimal Abl substrate peptide are shown. Error bars represent S.D. Significance levels in comparison with control are indicated (*, p < 0.05; **, p < 0.01; unpaired t test). The lower panel compares relative kinase activity in the presence of the indicated monobodies. Error bars represent S.D. B, inhibition of the Bcr-Abl kinase expressed in HEK293 cells by co-expressed monobodies. Besides AS25 and AS27, the first generation monobody directed to the SH2-kinase interface, 7c12 (9), and HA4(Y87A) are included. Phosphorylation of Abl Tyr-412 in the kinase activation loop was normalized to the total Bcr-Abl amount by quantitative immunoblotting. The graph shows quantification of the blots. Error bars represent S.D. C, effect of monobody expression on proliferation of the K562 cell line. The relative population of monobody (Mb)-expressing cells to non-expressing cells quantified using flow cytometry is plotted versus time after viral transduction. D, the fractions among the GFP-positive cells from C that were positive for early (Annexin V; left panel) and late (7-aminoactinomycin D; right panel) apoptosis markers are plotted versus time after viral transduction.
FIGURE 7.
FIGURE 7.
Interactions and effects of monobodies in cellular contexts. A, a scheme showing the principle of the pulldown experiment (left) and the results (graphs) from two independent experiments. The left graph shows results obtained with an anti-Bcr antibody, and the right graph shows results obtained with a monobody binding to the Tyr(P)-binding pocket of the Abl SH2 domain. B, besides AS25 and AS27, the first generation monobody directed to the SH2-kinase interface, 7c12 (9), and HA4 harboring the Y87A mutation (13) as a non-binding negative control were co-expressed as Myc-tagged proteins with a constitutively active mutant of Abl (Abl PP) and the same mutant in which the SH2-kinase interface was disrupted in addition (Abl PP(I164E)) in HEK293 cells. Immunoprecipitation (IP) with an anti-Abl antibody revealed equal levels of Abl PP protein in the immunoprecipitates (upper panel), whereas AS25 and AS27 and to a lesser extent 7c12 were co-precipitated (lower panel). C, HA4(Y87A), AS25, and AS27 were co-expressed with Abl PP in HEK293 cells in duplicates. Equal amounts of total cell lysate were immunoblotted with the indicated antibodies. D, total Abl tyrosine phosphorylation levels (left graph) and phosphorylation of Abl Tyr-412 in the kinase activation loop (right graph) of the samples in C were normalized to the total Abl amount by quantitative immunoblotting. The graphs show quantification of the blots. Error bars represent S.D. The levels were scaled so that the level for HA4(Y87A) corresponded to 1.0. Significance levels in comparison with HA4(Y87A) are indicated (*, p < 0.05; **, p < 0.01; unpaired t test).

References

    1. Holohan C., Van Schaeybroeck S., Longley D. B., and Johnston P. G. (2013) Cancer drug resistance: an evolving paradigm. Nat. Rev. Cancer 13, 714–726 - PubMed
    1. Shah N. P., and Sawyers C. L. (2003) Mechanisms of resistance to STI571 in Philadelphia chromosome-associated leukemias. Oncogene 22, 7389–7395 - PubMed
    1. Deininger M. W., Goldman J. M., and Melo J. V. (2000) The molecular biology of chronic myeloid leukemia. Blood 96, 3343–3356 - PubMed
    1. Shah N. P., Nicoll J. M., Nagar B., Gorre M. E., Paquette R. L., Kuriyan J., and Sawyers C. L. (2002) Multiple BCR-ABL kinase domain mutations confer polyclonal resistance to the tyrosine kinase inhibitor imatinib (STI571) in chronic phase and blast crisis chronic myeloid leukemia. Cancer Cell 2, 117–125 - PubMed
    1. Hantschel O., Grebien F., and Superti-Furga G. (2012) The growing arsenal of ATP-competitive and allosteric inhibitors of BCR-ABL. Cancer Res. 72, 4890–4895 - PMC - PubMed

Publication types

MeSH terms

Substances