. 2016 May 6;291(19):10293-306.
doi: 10.1074/jbc.M115.691154. Epub 2016 Feb 24.

Quantification of Cooperativity in Heterodimer-DNA Binding Improves the Accuracy of Binding Specificity Models

Affiliations

Quantification of Cooperativity in Heterodimer-DNA Binding Improves the Accuracy of Binding Specificity Models

Alina Isakova et al. J Biol Chem. .

Abstract

Many transcription factors (TFs) have the ability to cooperate on DNA elements as heterodimers. Despite the significance of TF heterodimerization for gene regulation, a quantitative understanding of cooperativity between various TF dimer partners and its impact on heterodimer DNA binding specificity models is still lacking. Here, we used a novel integrative approach, combining microfluidics-steered measurements of dimer-DNA assembly with mechanistic modeling of the implicated protein-protein-DNA interactions to quantitatively interrogate the cooperative DNA binding behavior of the adipogenic peroxisome proliferator-activated receptor γ (PPARγ):retinoid X receptor α (RXRα) heterodimer. Using the high throughput MITOMI (mechanically induced trapping of molecular interactions) platform, we derived equilibrium DNA binding data for PPARγ, RXRα, as well as the PPARγ:RXRα heterodimer to more than 300 target DNA sites and variants thereof. We then quantified cooperativity underlying heterodimer-DNA binding and derived an integrative heterodimer DNA binding constant. Using this cooperativity-inclusive constant, we were able to build a heterodimer-DNA binding specificity model that has superior predictive power than the one based on a regular one-site equilibrium. Our data further revealed that individual nucleotide substitutions within the target site affect the extent of cooperativity in PPARγ:RXRα-DNA binding. Our study therefore emphasizes the importance of assessing cooperativity when generating DNA binding specificity models for heterodimers.

Keywords: DNA-binding protein; computational biology; cooperativity; heterodimer-DNA interactions; specificity models; transcription; transcription regulation.


Figures

FIGURE 1.
FIGURE 1.
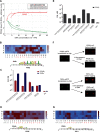
On-chip heterodimer-DNA assembly. A, schematic representation of the experimental setup. Step 1, PPARγ fused to an eGFP tag is immobilized on the surface of a MITOMI chip with an anti-GFP antibody. Step 2, RXRα tagged with mCherry and Cy5-labeled DNA baits are introduced into the system; step 3, immobilized PPARγ, RXRα, and DNA baits are then incubated for 1 h to allow system equilibration and complex assembly; step 4, newly formed complexes are trapped under a flexible PDMS membrane, and unbound molecules as well as molecular complexes are washed away. B, fluorescence-based readout of PPARγ-GFP, RXRα-mCherry, and Cy5-labeled target DNA from 10 MITOMI units. The two upper panels represent PPARγ-GFP and RXRα-mCherry detected in the center of each unit (under the PDMS membrane). The two lower panels represent the variable amounts of Cy5-labeled target DNA molecules detected in the same 10 MITOMI units, before (DNA-free) and after (DNA-bound) trapping. C, corresponding quantitative readout of B where the quantified amounts of both PPARγ and RXRα remain constant, but the amount of bound DNA increases with the input DNA concentration until it reaches saturation. The corresponding quantities of proteins and DNA are expressed in relative fluorescent units (RFU).
SCHEME 1.
SCHEME 1.
FIGURE 2.
FIGURE 2.
DNA binding preferences of PPARγ, RXRα, as well as the PPARγ:RXRα heterodimer. A, linear fits of binding data. Examples of binding curves and corresponding linear fits of PPARγ, RXRα, and PPARγ:RXRα heterodimer interactions with sequences containing putative nuclear receptor binding sites. B, relative DNA binding affinities of PPARγ, RXRα, and the PPARγ:RXRα heterodimer to five putative nuclear receptor-binding sites and variants thereof. Each sequence family is defined by the orientation of the canonical hexameric sites (represented by arrows) and the spacing between them.
FIGURE 3.
FIGURE 3.
DNA binding behavior of PPARγ and RXRα on PPRE, PAL3, or variants thereof. A, heterodimer formation in the presence of PPRE and PAL3 DNA at different concentrations. B, DNA binding landscape of RXRα monomer to single nucleotide variants of PPRE. The heatmap represents the mean of ddG values (the difference in Gibbs energy of RXRα binding to a mutant site compared with the energy of RXRα binding to canonical PPRE) derived from two independent MITOMI experiments. The sequence of the canonical PPRE is indicated along the x axis. Two core hexamer repeats, constituting the DR1, are highlighted in red. Below heatmap: energy-normalized sequence logo (39) derived from the matrix of the binding energy contribution for each base at each position of PPRE. C, binding affinities of PPARγ or RXRα to DR1 and PAL3 sites or truncated variants thereof. D, same as for B, but for PPARγ instead of RXRα. E, binding affinities of PPARγ to variants of DR1 and PAL3 sites. F, visualization of on-chip assembly of putative PPARγ and RXRα dimers. mC refers to the fluorescent tag mCherry (red). G, DNA binding landscape of PPARγ monomer to PAL3 or single nucleotide variants thereof. Each bar represents the mean and standard deviation of ddG derived from two independent MITOMI experiments. Below heatmap: energy normalized sequence logo (39) derived from the matrix of the binding energy contribution for each base at each position in the PAL3 element.
FIGURE 4.
FIGURE 4.
Cooperative TF-DNA interactions. A, examples of binding curves representing PPARγ:RXRα binding to PPRE or variants thereof. The nucleotide that was substituted in each sampled sequence is highlighted in red. B, binding of the PPARγ:RXRα heterodimer to the DR1 element in function of different DNA and PPARγ concentrations. One example of a strongly (left) and weakly (right) bound sequence, respectively, is shown. Raw experimental data are represented by black dots, and the surface plot represents the regression of the data using Voronoi interpolation. The amount of bound DNA is expressed in arbitrary units (a.u.). C, schematic representation of various scenarios of heterodimer formation. We allow the heterodimer to be formed through either the monomer or dimer scenarios.
FIGURE 5.
FIGURE 5.
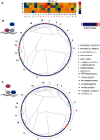
Significance of cooperative effects in PPARγ:RXRα-DNA binding. A, cooperativity map represents log ω1,2 values calculated for each PPRE variant. B, DNA affinity change (σ) upon PPARγ heterodimerization with RXRα. 192 sequences were clustered using MAFFT and plotted as a phylotree. The representative sequence of each subtree is denoted outside of the tree circle. The values of occupancy change observed for each sequence are plotted as color plots at the terminal nodes of the phylotree. C, same as B, but for RXRα heterodimerization with PPARγ.
FIGURE 6.
FIGURE 6.
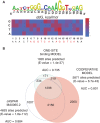
Prediction of in vivo binding. A, affinity map as well as the corresponding sequence logo (energy normalized sequence logo) (39) of PPARγ:RXRα heterodimer binding to PPRE. The affinity map represents the KDoD values as calculated based on our cooperativity model. B, Venn diagram of the number of PPARγ:RXRα binding sites predicted by three different specificity models independently. The PPARγ:RXRα motif occurrence predicted within 200-bp genomic regions identified through ChIP-seq at day 6 of 3T3-L1 adipocyte differentiation.

References

    1. Davidson E. H., and Erwin D. H. (2006) Gene regulatory networks and the evolution of animal body plans. Science 311, 796–800 - PubMed
    1. Deplancke B. (2009) Experimental advances in the characterization of metazoan gene regulatory networks. Brief. Funct. Genomic Proteomic 8, 12–27 - PubMed
    1. Badis G., Berger M. F., Philippakis A. A., Talukder S., Gehrke A. R., Jaeger S. A., Chan E. T., Metzler G., Vedenko A., Chen X., Kuznetsov H., Wang C. F., Coburn D., Newburger D. E., Morris Q., et al. (2009) Diversity and complexity in DNA recognition by transcription factors. Science 324, 1720–1723 - PMC - PubMed
    1. Fordyce P. M., Pincus D., Kimmig P., Nelson C. S., El-Samad H., Walter P., and DeRisi J. L. (2012) Basic leucine zipper transcription factor Hac1 binds DNA in two distinct modes as revealed by microfluidic analyses. Proc. Natl. Acad. Sci. U.S.A. 109, E3084–E3093 - PMC - PubMed
    1. Galas D. J., and Schmitz A. (1978) DNase footprinting a simple method for the detection of protein-DNA binding specificity. Nucleic Acids Res. 5, 3157–3170 - PMC - PubMed

Publication types

LinkOut - more resources